|

Silver Price Analysis: XAG/USD bears need validation from $22.10 and FOMC Minutes

  • Silver Price retreats towards seven-week-old horizontal support amid cautious mood.
  • Economic fears emanating from China, firmer US Dollar weigh on XAG/USD price.
  • RSI conditions, multi-day-long horizontal region prod Silver sellers.
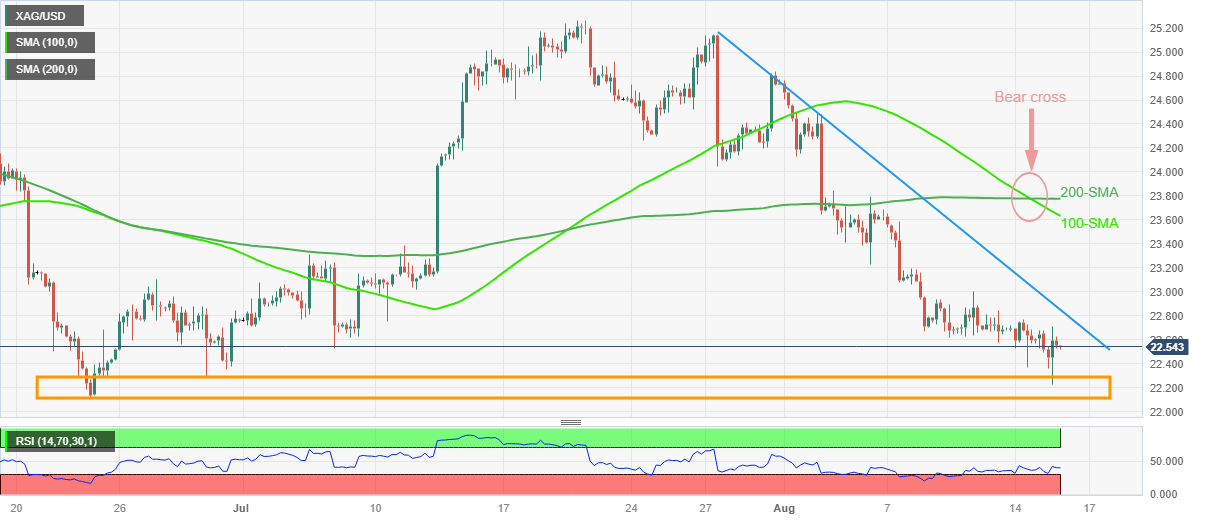
  • Bear cross, sustained trading below the key resistance line and SMAs challenge XAG/USD recovery hope.

Silver Price (XAG/USD) remains pressured at the lowest level in seven weeks despite making rounds to $22.50 during the early Asian session on Wednesday. In doing so, the bright metal fades the previous day’s corrective bounce off the key support zone amid the market’s broad risk-off mood and the firmer US Dollar and the Federal Reserve (Fed) monetary policy meeting minutes.

It’s worth noting that China-inflicted market pessimism joins the firmer US data to underpin the US Dollar’s run-up and weigh on the XAG/USD ahead of this week’s top-tier catalyst.

Technically, the 100-SMA stays beneath the 200-SMA and portrays the “Bear Cross”, which in turn suggests further downside of the Silver Price. Also keeping the XAG/USD sellers hopeful is the commodity’s sustained trading below a three-week-long descending resistance line.

However, a horizontal area comprising multiple levels marked since June 23, close to $22.10–30, puts a floor under the XAG/USD price amid a nearly oversold RSI (14) line.

In a case where the Silver Price breaks the $22.10 support, it becomes vulnerable to testing the early March swing high of around $21.30 with the $22.00 threshold likely acting as an intermediate halt.

On the flip side, a clear break of the immediate resistance line, close to $22.85 at the latest, will direct the XAG/USD toward the 100-SMA hurdle of around $23.65. Though, the 200-SMA level of near $23.80 acts as the final defense of the Silver sellers.

Silver Price: Four-hour chart

Trend: Limited downside expected

Additional important levels

Overview
Today last price22.54
Today Daily Change-0.06
Today Daily Change %-0.27%
Today daily open22.6
 
Trends
Daily SMA2023.93
Daily SMA5023.64
Daily SMA10024.05
Daily SMA20023.26
 
Levels
Previous Daily High22.76
Previous Daily Low22.37
Previous Weekly High23.68
Previous Weekly Low22.58
Previous Monthly High25.27
Previous Monthly Low22.52
Daily Fibonacci 38.2%22.52
Daily Fibonacci 61.8%22.61
Daily Pivot Point S122.39
Daily Pivot Point S222.18
Daily Pivot Point S321.99
Daily Pivot Point R122.79
Daily Pivot Point R222.97
Daily Pivot Point R323.18

Author

Anil Panchal

Anil Panchal

FXStreet

Anil Panchal has nearly 15 years of experience in tracking financial markets. With a keen interest in macroeconomics, Anil aptly tracks global news/updates and stays well-informed about the global financial moves and their implications.

More from Anil Panchal
Share:

Markets move fast. We move first.

Orange Juice Newsletter brings you expert driven insights - not headlines. Every day on your inbox.

By subscribing you agree to our Terms and conditions.

Editor's Picks

EUR/USD clings to small gains near 1.1750

Following a short-lasting correction in the early European session, EUR/USD regains its traction and clings to moderate gains at around 1.1750 on Monday. Nevertheless, the pair's volatility remains low, with investors awaiting this weeks key data releases from the US and the ECB policy announcements.

GBP/USD edges higher toward 1.3400 ahead of US data and BoE

GBP/USD reverses its direction and advances toward 1.3400 following a drop to the 1.3350 area earlier in the day. The US Dollar struggles to gather recovery momentum as markets await Tuesday's Nonfarm Payrolls data, while the Pound Sterling holds steady ahead of the BoE policy announcements later in the week.

Gold pulls away from session high, holds above $4,300

Gold loses its bullish momentum and retreats below $4,350 after testing this level earlier on Monday. XAU/USD, however, stays in positive territory as the US Dollar remains on the back foot on growing expectations for a dovish Fed policy outlook next year.

Solana consolidates as spot ETF inflows near $1 billion signal institutional dip-buying

Solana price hovers above $131 at the time of writing on Monday, nearing the upper boundary of a falling wedge pattern, awaiting a decisive breakout. On the institutional side, demand for spot Solana Exchange-Traded Funds remained firm, pushing total assets under management to nearly $1 billion since launch. 

Big week ends with big doubts

The S&P 500 continued to push higher yesterday as the US 2-year yield wavered around the 3.50% mark following a Federal Reserve (Fed) rate cut earlier this week that was ultimately perceived as not that hawkish after all. The cut is especially boosting the non-tech pockets of the market.

Solana Price Forecast: SOL consolidates as spot ETF inflows near $1 billion signal institutional dip-buying

Solana (SOL) price hovers above $131 at the time of writing on Monday, nearing the upper boundary of a falling wedge pattern, awaiting a decisive breakout.