|

Silver Price Analysis: XAG/USD bears keep the reins around 10-week low under $22.00

  • Silver prints three-day losing streak as sellers flirt with 2.5-month low.
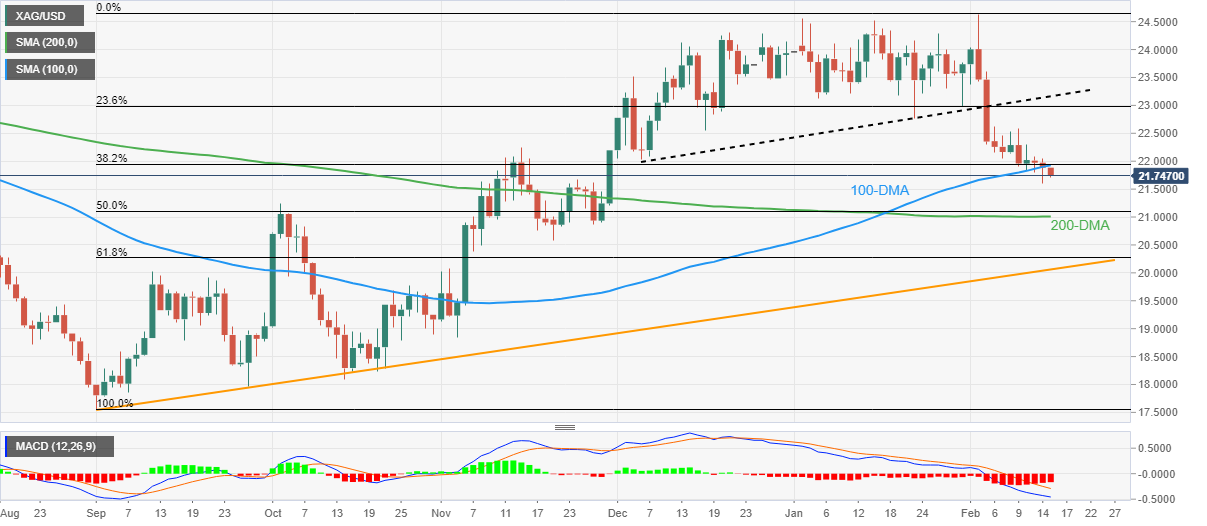
  • Clear downside break of 100-DMA, bearish MACD signals favor sellers.
  • 50% Fibonacci retracement, 200-DMA challenge further downside.
  • Recovery remains elusive unless crossing $23.15, ascending trend line from early September 2022 adds to the downside filters.

Silver price (XAG/USD) remains on the bear’s radar as the bright metal renews intraday low near $21.70 during early Wednesday in Europe. In doing so, the bullion stays pressured around the lowest levels since November 30 amid a three-day downtrend.

The quote’s weakness could be linked to the daily closing below the 100-DMA, as well as sustained trading below the previous support line from early December 2022, respectively near $21.95 and $23.15.

As a result, the XAG/USD bears have a free hand while expecting further downside of the metal.

However, the 50% Fibonacci retracement of September 2022 to February 2023 upside, near $21.10, precedes the 200-DMA level of $21.00 to offer a strong challenge to the Silver sellers.

Following that, the 61.8% Fibonacci retracement surrounding $20.30, also known as the golden Fibonacci ratio, as well as a 5.5-month-old ascending support line, close to $20.00 round figure, will become the key for the XAG/USD sellers to watch.

Alternatively, recovery moves need to stay beyond the 100-DMA hurdle of $21.95, as well as the $22.00 round figure to convince intraday buyers of the Silver.

Even so, the previous weekly high near $22.60 and the support-turned-resistance line from December 06, 2022, close to $23.15, could challenge the XAG/USD bulls before giving them control.

Silver price: Daily chart

Trend: Further downside expected

Additional important levels

Overview
Today last price21.73
Today Daily Change-0.15
Today Daily Change %-0.69%
Today daily open21.88
 
Trends
Daily SMA2023.07
Daily SMA5023.42
Daily SMA10021.9
Daily SMA20021.01
 
Levels
Previous Daily High22.04
Previous Daily Low21.61
Previous Weekly High22.62
Previous Weekly Low21.84
Previous Monthly High24.55
Previous Monthly Low22.76
Daily Fibonacci 38.2%21.77
Daily Fibonacci 61.8%21.88
Daily Pivot Point S121.65
Daily Pivot Point S221.41
Daily Pivot Point S321.21
Daily Pivot Point R122.08
Daily Pivot Point R222.28
Daily Pivot Point R322.52

Author

Anil Panchal

Anil Panchal

FXStreet

Anil Panchal has nearly 15 years of experience in tracking financial markets. With a keen interest in macroeconomics, Anil aptly tracks global news/updates and stays well-informed about the global financial moves and their implications.

More from Anil Panchal
Share:

Markets move fast. We move first.

Orange Juice Newsletter brings you expert driven insights - not headlines. Every day on your inbox.

By subscribing you agree to our Terms and conditions.

Editor's Picks

EUR/USD stays defensive below 1.1750 as USD finds its feet

EUR/USD kicks off the new week on a softer note, holding below 1.1750 in European trading on Monday. The pair faces challenges due to a pause in the US Dollar downtrend, with traders shifting their focus to the delayed US Nonfarm Payrolls and CPI data for fresh directives. The ECB policy decision is also eagerly awaited. 

GBP/USD holds steady above 1.3350 as traders await key data and BoE

GBP/USD remains on the back foot above 1.3350 in the European session on Monday, though it lacks bearish conviction and holds above the key 200-day SMA support. The US Dollar holds its recovery mode ahead of key data releases, while the Pound Sterling faces headwinds from the expected BoE rate cut this week. 

Gold climbs to seven-week highs on Fed rate cut bets, safe-haven demand

Gold price rises to seven-week highs to near $4,350 during the early European trading hours on Monday. The precious metal extends its upside amid the prospect of interest rate cuts by the US Fed next year. Lower interest rates could reduce the opportunity cost of holding Gold, supporting the non-yielding precious metal.

Solana consolidates as spot ETF inflows near $1 billion signal institutional dip-buying

Solana price hovers above $131 at the time of writing on Monday, nearing the upper boundary of a falling wedge pattern, awaiting a decisive breakout. On the institutional side, demand for spot Solana Exchange-Traded Funds remained firm, pushing total assets under management to nearly $1 billion since launch. 

Big week ends with big doubts

The S&P 500 continued to push higher yesterday as the US 2-year yield wavered around the 3.50% mark following a Federal Reserve (Fed) rate cut earlier this week that was ultimately perceived as not that hawkish after all. The cut is especially boosting the non-tech pockets of the market.

Solana Price Forecast: SOL consolidates as spot ETF inflows near $1 billion signal institutional dip-buying

Solana (SOL) price hovers above $131 at the time of writing on Monday, nearing the upper boundary of a falling wedge pattern, awaiting a decisive breakout.