|

Silver Price Analysis: XAG/USD bears have the upper hand below 100-day SMA

  • Silver breaks through the 100-day SMA support and drops to a nearly two-month low.
  • The technical setup favours bearish traders and supports prospects for further losses.
  • A sustained strength beyond the $24.00 mark is needed to negate the bearish outlook.

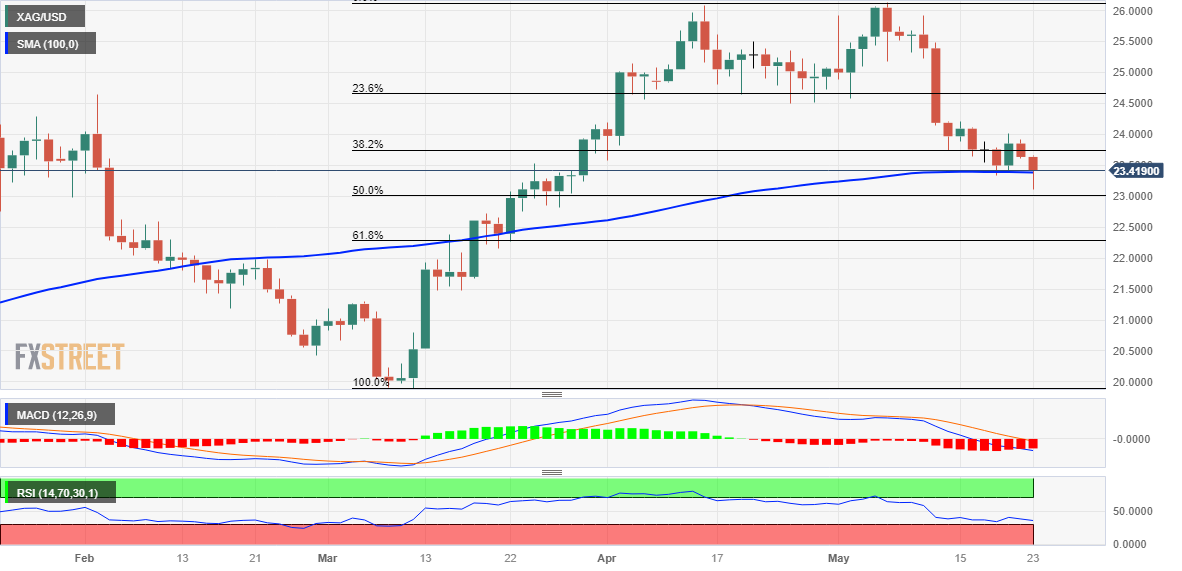
Silver continues losing ground for the second successive day on Tuesday and confirms a fresh bearish breakdown through the 100-day Simple Moving Average (SMA). The white metal maintains its heavily offered tone through the early North American session and currently trades around the $23.25-$23.30 region, just above a nearly two-month low.

The recent repeated failures near the $24.00 round-figure mark and the subsequent slide below a technically significant moving average could be seen as a fresh trigger for bearish traders. Moreover, oscillators on the daily chart are holding deep in the negative territory and are still far from being in the oversold zone. This, in turn, supports prospects for an extension of the recent retracement slide from over a one-year top, around the $26.15 region touched earlier this month.

Some follow-through selling below the $23.00 mark, which coincides with the 50% Fibonacci retracement level of the March-May rally, will reaffirm the negative outlook. The XAG/USD might then accelerate the fall towards intermediate support near the $22.60-$22.55 region before eventually dropping to the 61.8% Fibo. level, around the $22.25-$22.20 region. This is followed by the $22.00 mark, which if broken decisively will set the stage for a further near-term depreciating move.

On the flip side, attempted recovery back above the 100-day SMA, currently around the $23.35 region, is more likely to attract fresh sellers near the 38.2% Fibo. level, around the $23.75 area. This, in turn, should cap the upside for the XAG/USD near the $24.00 round-figure mark. Some follow-through buying beyond the $24.20-$24.25 region, however, might negate the near-term bearish outlook and prompt an aggressive short-covering rally towards the $25.00 psychological mark.

Silver daily chart

fxsoriginal

Key levels to watch

XAG/USD

Overview
Today last price23.35
Today Daily Change-0.29
Today Daily Change %-1.23
Today daily open23.64
 
Trends
Daily SMA2024.75
Daily SMA5024.26
Daily SMA10023.39
Daily SMA20021.95
 
Levels
Previous Daily High23.92
Previous Daily Low23.61
Previous Weekly High24.21
Previous Weekly Low23.33
Previous Monthly High26.09
Previous Monthly Low23.57
Daily Fibonacci 38.2%23.73
Daily Fibonacci 61.8%23.8
Daily Pivot Point S123.52
Daily Pivot Point S223.41
Daily Pivot Point S323.21
Daily Pivot Point R123.84
Daily Pivot Point R224.04
Daily Pivot Point R324.15

Author

Haresh Menghani

Haresh Menghani is a detail-oriented professional with 10+ years of extensive experience in analysing the global financial markets.

More from Haresh Menghani
Share:

Editor's Picks

EUR/USD looks apathetic around 1.1770

EUR/USD comes under renewed pressure on Tuesday, deflating below the 1.1800 support and reversing two consecutive days of gains. The pair’s decline follows the persistent move higher in the US Dollar, as trade uncertainty dominates the sentiment ahead of President Trump’s SOTU speech.

GBP/USD regains 1.3500 and above

GBP/USD extends its advance for the third day in a row on Tuesday, this time retesting the area beyond the 1.3500 hurdle. Cable’s uptick comes despite decent gains in the Greenback and the dovish message from the BoE’s Bailey at the UK Parliament.

Gold appears offered around $5,150

Gold is giving back a good portion of the recent multi-day rally, receding to the $5,150 zone per troy ounce amid the decent bounce in the US Dollar and mixed US Treasuty yields. In the meantime, markets’ attention remain on upcoming comments from Fed speakers.

Ripple’s DeFi shift in focus: Navigating XRPL EVM sidechain growth, XRPFi migration and liquidity

Ripple (XRP) has continued to trade under pressure, extending its decline by approximately 63% from the record high of $3.66 in July. The remittance token is trading above support at $1.35, while its upside appears limited by key supply zones, starting with $1.40, at the time of writing on Tuesday.

The Citrini report: How a debatable AI narrative can shake Wall Street

That AI-related headline alone was enough to rattle investors.US stocks slid sharply on Monday after a widely circulated Citrini Research memo outlined a hypothetical “2028 Global Intelligence Crisis”, warning that rapid AI adoption could push US unemployment into double digits as early as by mid-2028.

XRP pressured by weak ETF flows and declining retail interest

Ripple (XRP) is edging lower, trading above its intraday low of $1.32 at the time of writing on Tuesday. The decline from its weekly opening of $1.39 reflects heightened volatility in the broader cryptocurrency market, accentuated by tariff-triggered uncertainty.