|

Silver Price Analysis: Silver finds support at June 13 low and consolidates

  • Silver has fallen to key support and is currently consolidating. 
  • If it breaks below the support it will continue its short-term downtrend within its channel. 
  • A bounce could also signal a return to the top of the channel and a critical level for Silver. 

Silver (XAG/USD) has fallen to a key support level at $28.66, the June 13 low, and is currently trading along that support. It is at a critical turning point for the trend. 

The precious metal is in a falling channel formation and the short-term trend is bearish on balance, suggesting the odds favor more downside, albeit with one caveat. 

Silver 4-hour Chart 

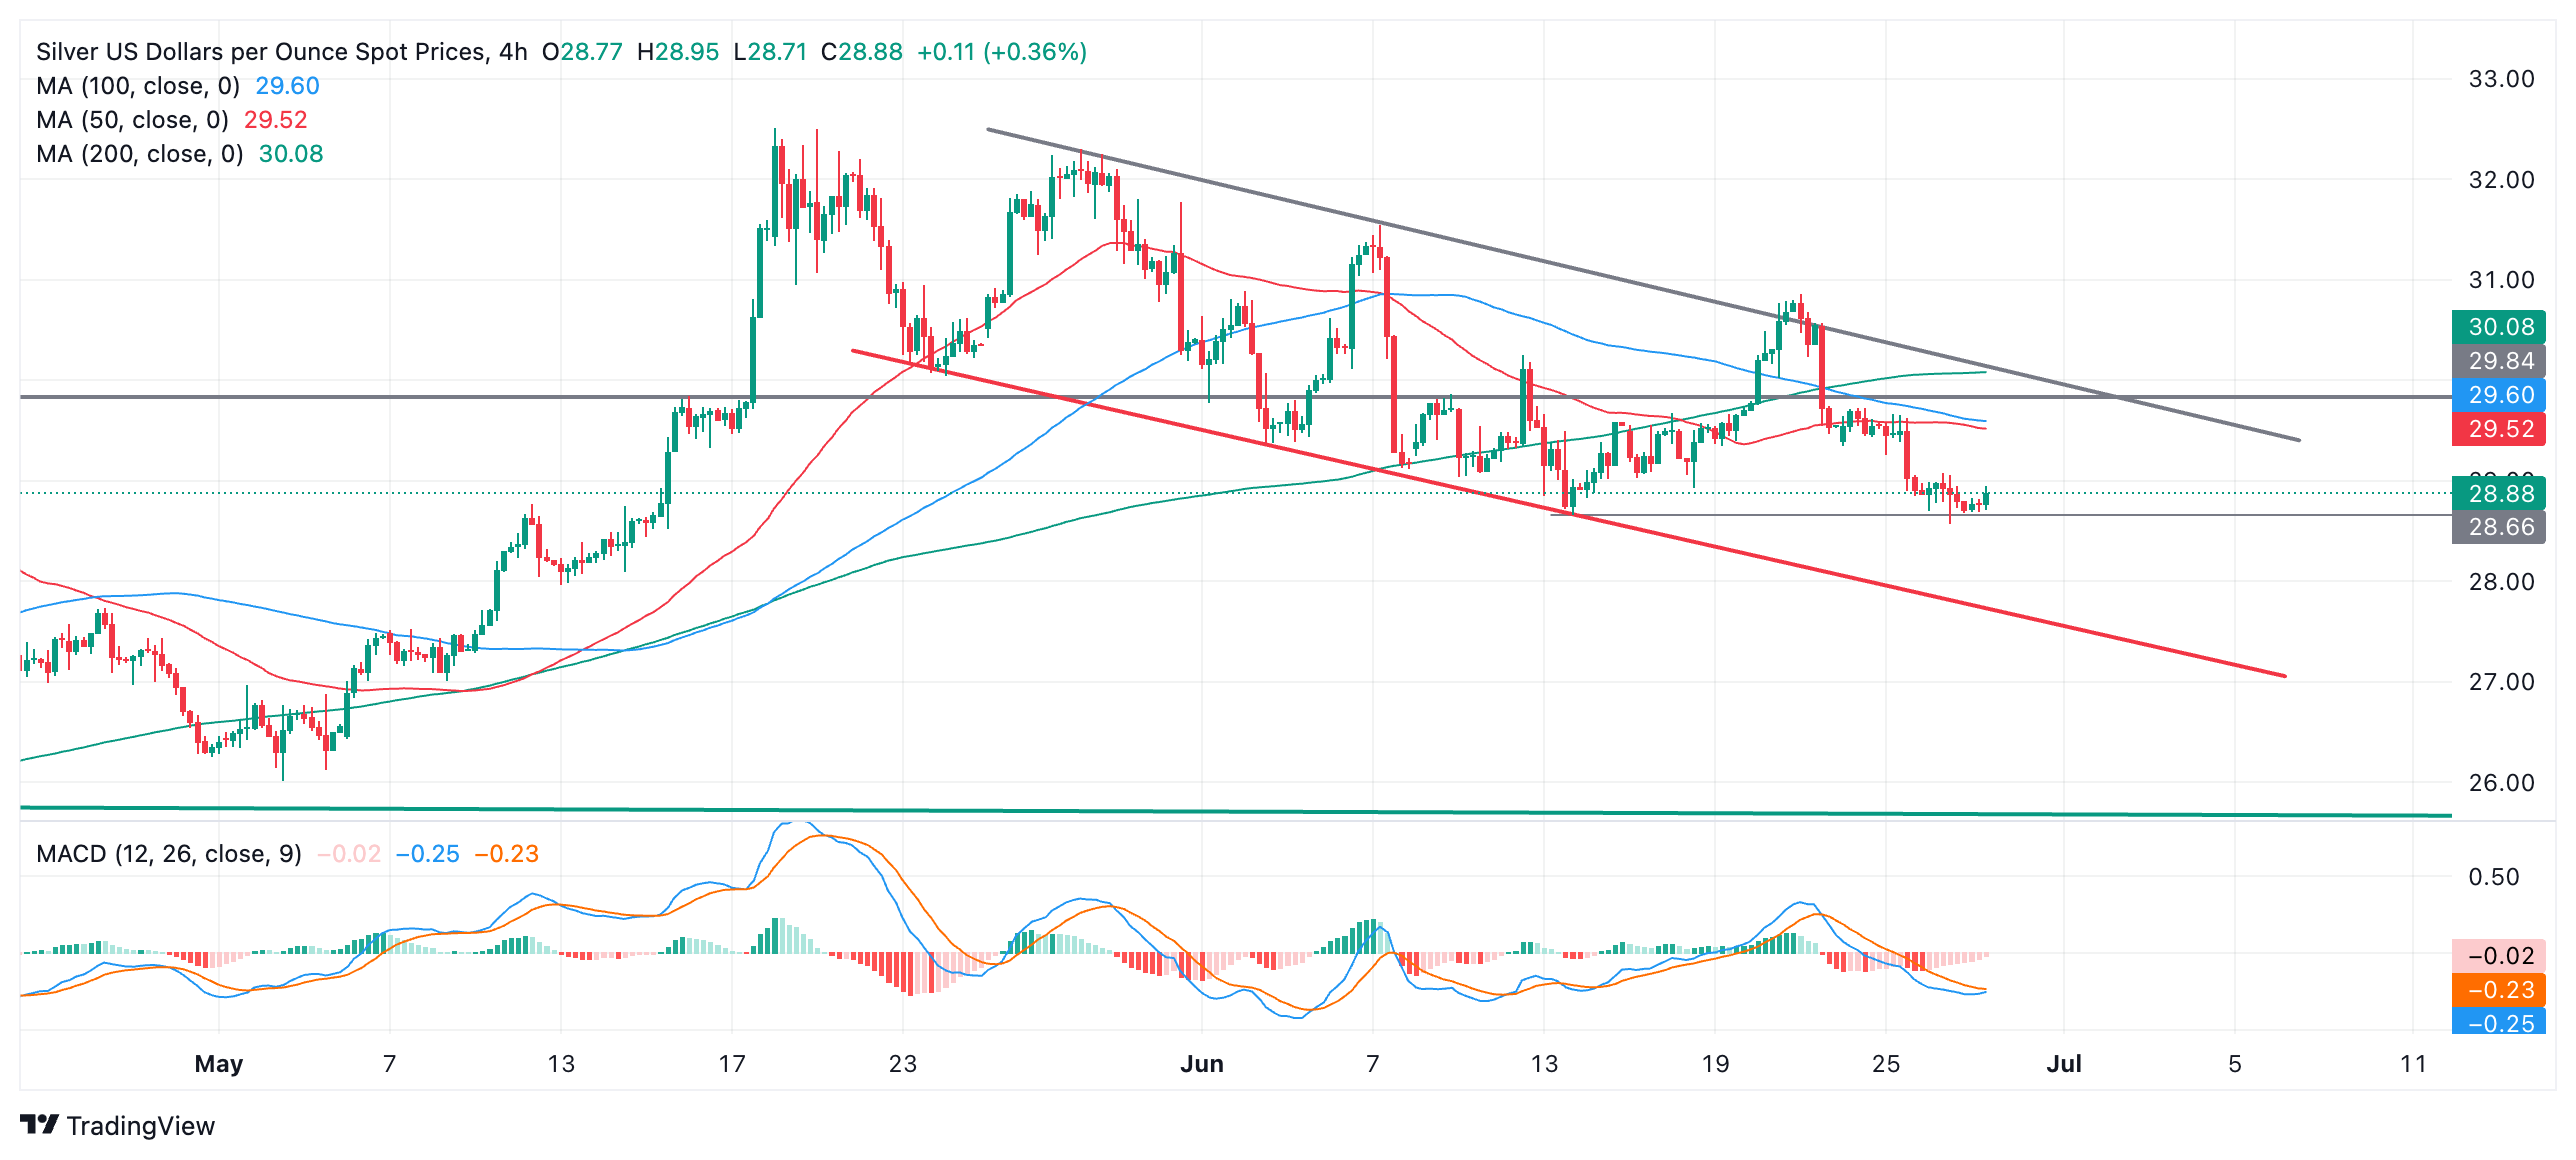
In the last few hours, Silver has bounced off of the $28.66 support level, however, given the trend is bearish and “the trend is your friend” an eventual break lower is expected.  

If price pierces below $28.57, the June 26 low, that would probably signal further weakness, with the next target lying at the lower channel line, at around $27.50. 

The caveat to this bearish picture lies in the fact that Silver temporarily broke out of the top of the falling channel on June 20, and although it quickly fell back, the fact it breached the integrity of the channel, albeit temporarily, indicates the upper channel line has been weakened and is more likely to be broken again.

If the June 13 lows hold, therefore, and Silver starts to recover, there is a chance it could rise back up to the upper channel line at around $29.90, which is also a major resistance level at the top of a four-year consolidation zone. A decisive break above that level would be required to indicate a change in the short-term trend. 

A decisive break would be one accompanied by a long green up candle that broke clearly above the level and closed near its high or three green candles in a row that broke above the level. 

Author

Joaquin Monfort

Joaquin Monfort is a financial writer and analyst with over 10 years experience writing about financial markets and alt data. He holds a degree in Anthropology from London University and a Diploma in Technical analysis.

More from Joaquin Monfort
Share:

Editor's Picks

AUD/USD eyes 0.7150 barrier nine-day EMA

AUD/USD inches higher after registering modest losses in the previous day, trading around 0.7130 during the Asian hours. The technical analysis of the daily chart indicates that the pair is moving sideways within the rectangle pattern, suggesting a consolidation as neither the bulls nor the bears have enough momentum to take control of the market.

USD/JPY trades below 160.00 intervention threshold; bullish bias intact

The USD/JPY pair attracts some sellers during the Asian session amid fears that authorities will step in again to prop up the Japanese Yen. Furthermore, the Israel-Lebanon truce prompts some profit-taking around the US Dollar and exerts downward pressure on the currency pair.

Gold puts its 200-day SMA to the test near $4,420

Gold keeps the bullish stance in place in the latter part of Thursday’s session, although a convincing break above the key $4,500 mark per troy ounce still remains elusive. The precious metal’s advance comes amid the resurgence of some selling interest around the Greenback, improving risk sentiment, and declining US Treasury yields across the board.

Bitcoin’s massive storm is back: Why the sell-off is far from over

Bitcoin price action over the last few weeks has felt less like a normal, healthy correction and more like a slow grinding crash that continues to wreak havoc on holdings and trading accounts. And everything suggests that the dramatic crash isn’t over.

Nonfarm payrolls: Testing the limits of Fed policy patience

The upcoming nonfarm payrolls report for May will provide the final update on the US labor market before Kevin Warsh attends his first policy meeting as the new Fed Chair later this month.

Recession on paper: What really moves the Canadian Loonie now?

Statistics Canada handed the headline writers a gift and the analysts a headache. Real GDP shrank 0.1% on an annualized basis in the first quarter, and with the fourth quarter of 2025 revised down to a 1.0% contraction, that is two negative quarters in a row, the textbook definition of a technical recession and Canada's first since the pandemic.