|

Silver Price Analysis: Pulling back within a probable downtrend

  • Silver is correcting within a short-term downtrend. 
  • A break below the June 13 lows would probably lead to a continuation of the trend of lower lows. 
  • The 50-day Simple Moving Average is an obstacle to bears pushing price lower. 

Silver (XAG/USD) trades a third of a percent lower in the $29.40s on Monday. Despite trading marginally lower on the day it has overall recovered since falling to a low of $28.66 on June 13. 

The precious metal is in a short-term downtrend, on balance, and given “the trend is your friend” this is likely to continue. The recovery since June 13 is probably a pull back rather than a reversal – once it finishes the downtrend will probably resume.

Silver 4-hour Chart 

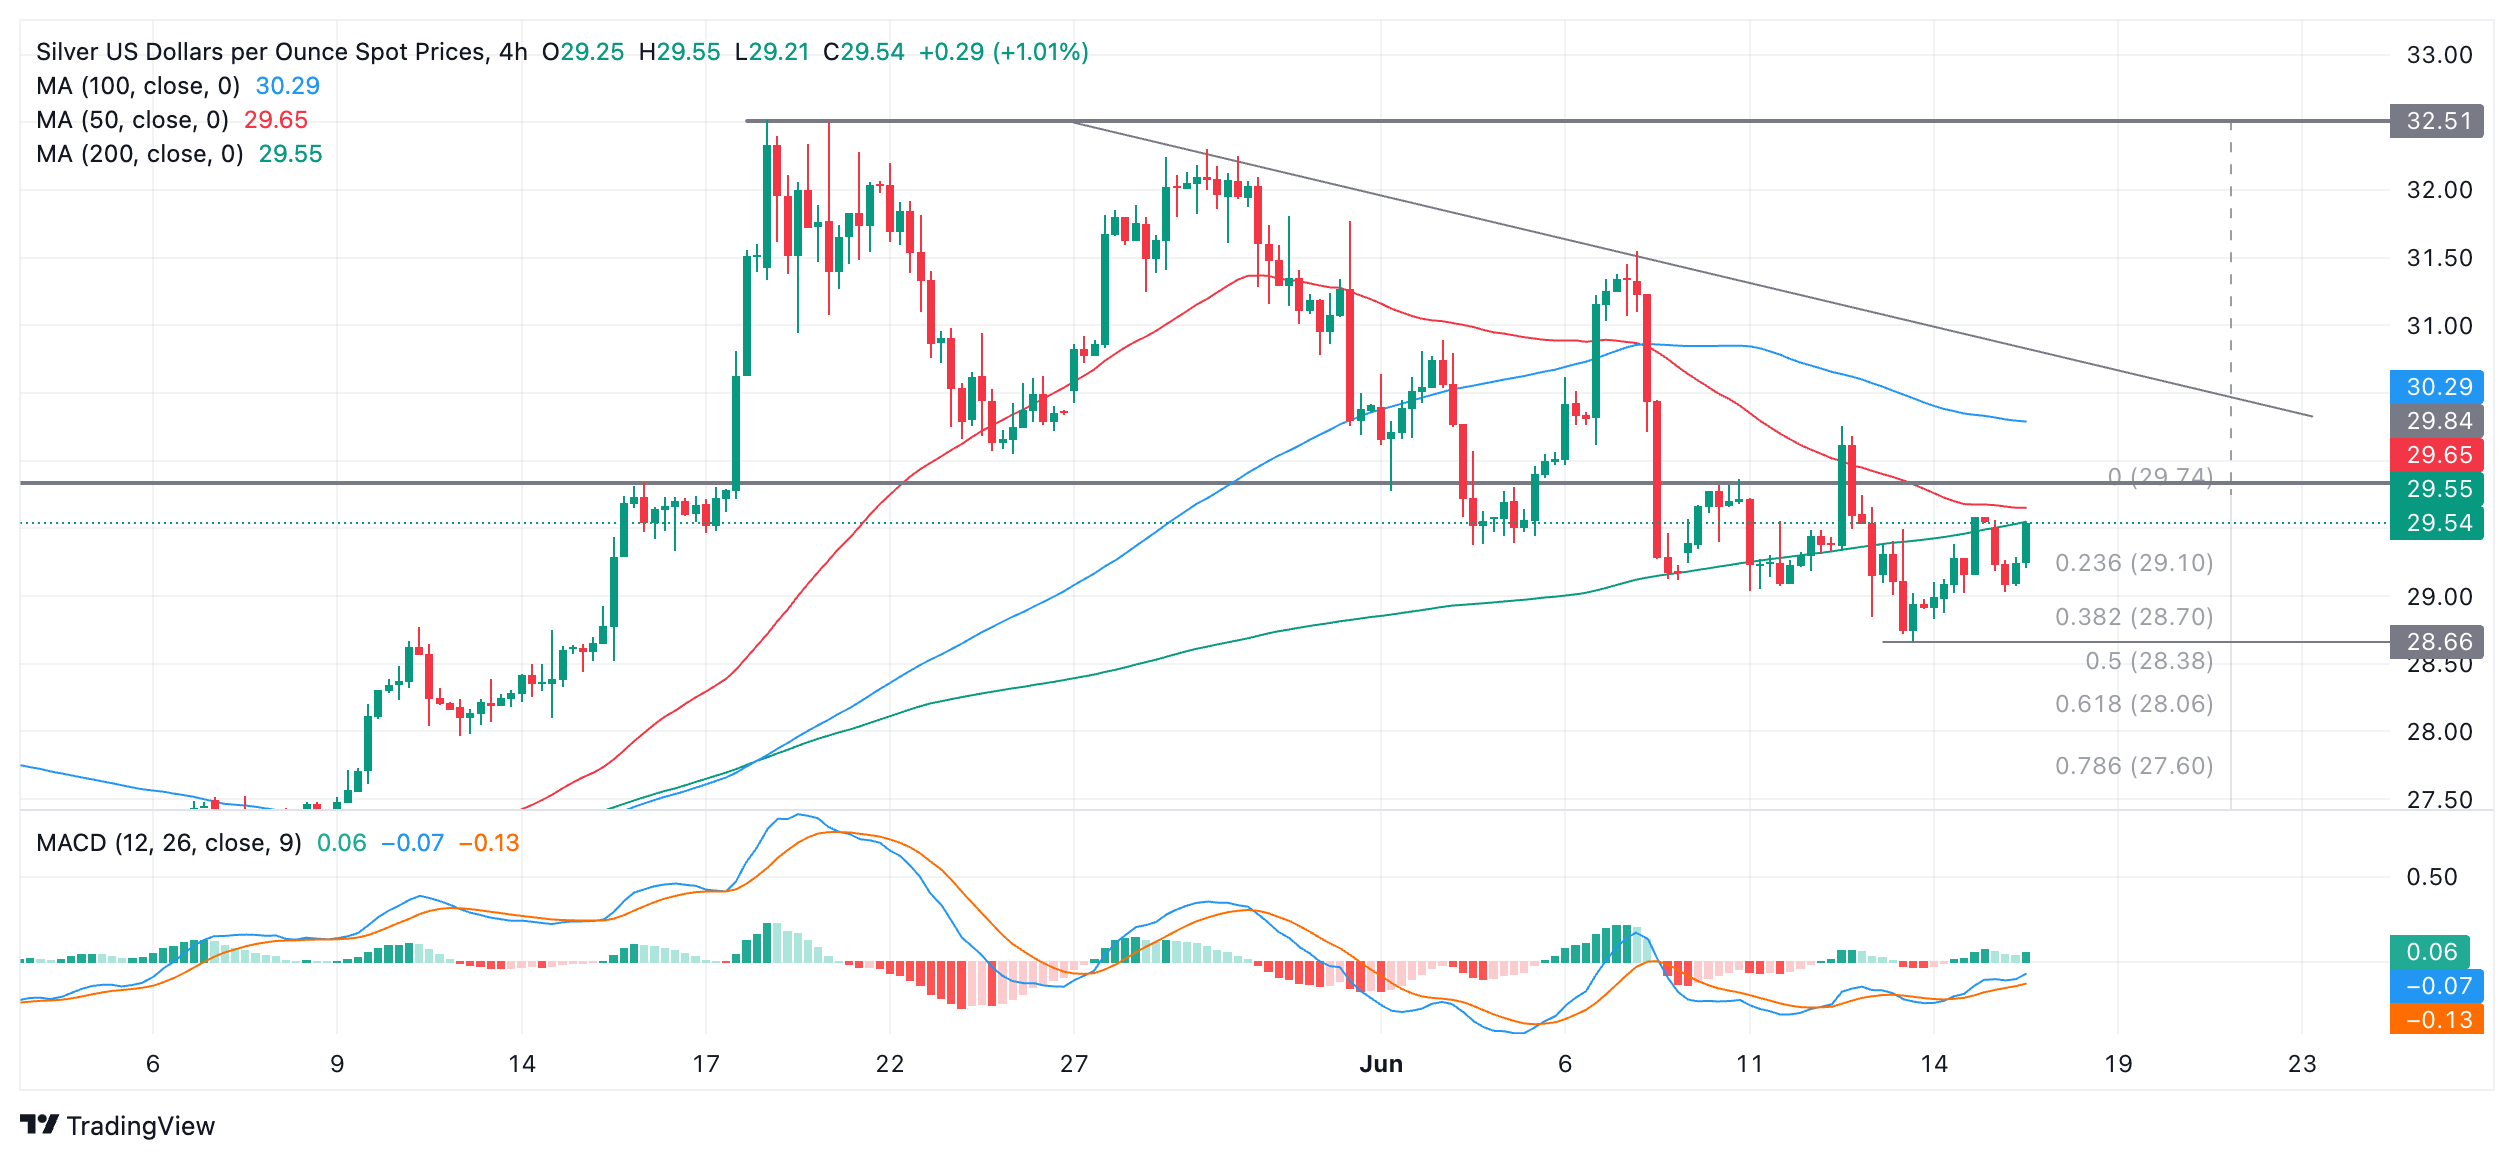
A break below $28.66 (June 13 low) would confirm another lower low, and a continuation of the bearish sequence. 

After that, Silver could fall to an initial, conservative target at $28.06, the 0.618 Fibonacci ratio of the height of the range that unfolded in the second half of May, extrapolated lower. 

The 50-day Simple Moving Average (SMA) at $29.01 could act as an obstacle to progress lower. 

Even more bearishness could see Silver reach as low as $27.02 (100% extrapolation of the height of the range lower). 

It would require a close above $30.50 to bring the short-term downtrend into doubt. A move above the $31.55 lower high would suggest the possibility of a recovery to the range high at $32.51, and a reversal of the short-term trend. 

Author

Joaquin Monfort

Joaquin Monfort is a financial writer and analyst with over 10 years experience writing about financial markets and alt data. He holds a degree in Anthropology from London University and a Diploma in Technical analysis.

More from Joaquin Monfort
Share:

Editor's Picks

AUD/USD eyes 0.7150 barrier nine-day EMA

AUD/USD inches higher after registering modest losses in the previous day, trading around 0.7130 during the Asian hours. The technical analysis of the daily chart indicates that the pair is moving sideways within the rectangle pattern, suggesting a consolidation as neither the bulls nor the bears have enough momentum to take control of the market.

USD/JPY trades below 160.00 intervention threshold; bullish bias intact

The USD/JPY pair attracts some sellers during the Asian session amid fears that authorities will step in again to prop up the Japanese Yen. Furthermore, the Israel-Lebanon truce prompts some profit-taking around the US Dollar and exerts downward pressure on the currency pair.

Gold puts its 200-day SMA to the test near $4,420

Gold keeps the bullish stance in place in the latter part of Thursday’s session, although a convincing break above the key $4,500 mark per troy ounce still remains elusive. The precious metal’s advance comes amid the resurgence of some selling interest around the Greenback, improving risk sentiment, and declining US Treasury yields across the board.

Bitcoin’s massive storm is back: Why the sell-off is far from over

Bitcoin price action over the last few weeks has felt less like a normal, healthy correction and more like a slow grinding crash that continues to wreak havoc on holdings and trading accounts. And everything suggests that the dramatic crash isn’t over.

Nonfarm payrolls: Testing the limits of Fed policy patience

The upcoming nonfarm payrolls report for May will provide the final update on the US labor market before Kevin Warsh attends his first policy meeting as the new Fed Chair later this month.

Recession on paper: What really moves the Canadian Loonie now?

Statistics Canada handed the headline writers a gift and the analysts a headache. Real GDP shrank 0.1% on an annualized basis in the first quarter, and with the fourth quarter of 2025 revised down to a 1.0% contraction, that is two negative quarters in a row, the textbook definition of a technical recession and Canada's first since the pandemic.