- Silver price has rallied up to just shy of $30.00, a key resistance level.
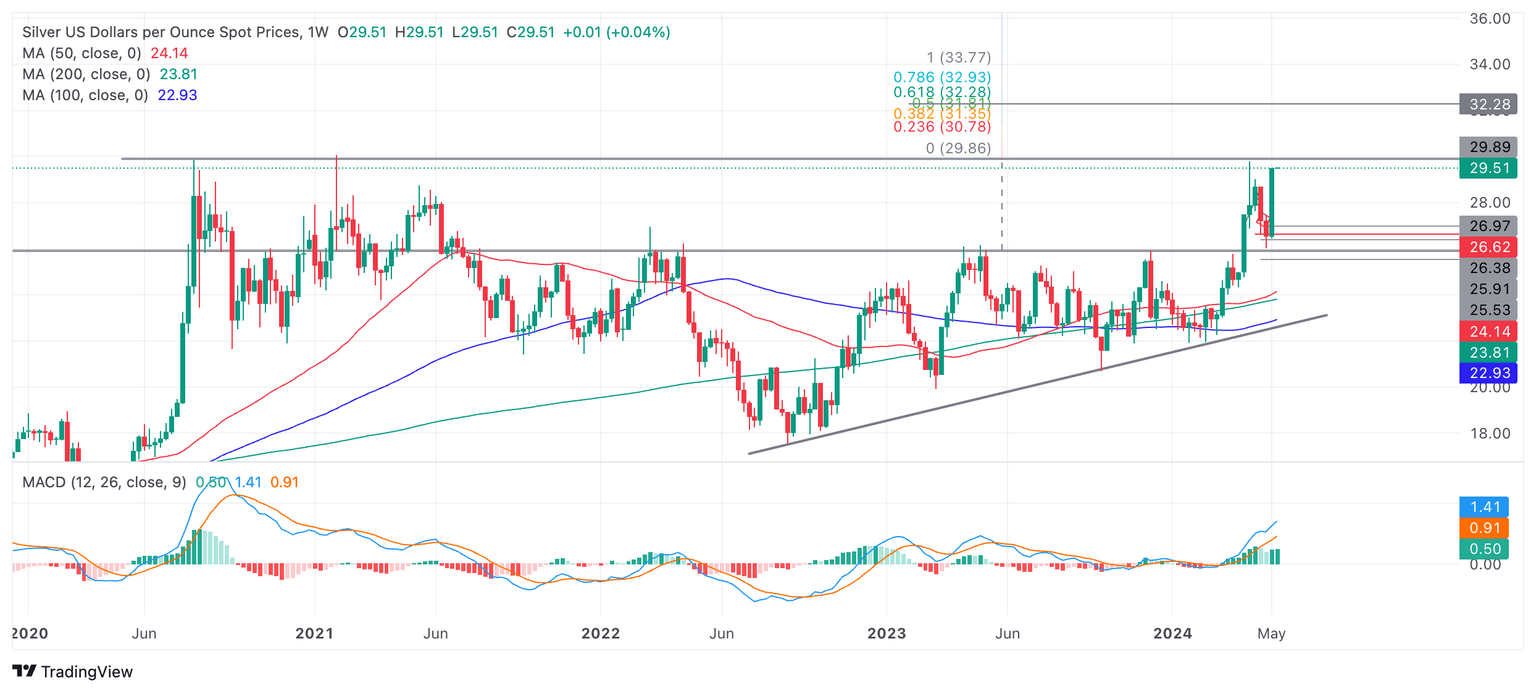
- The $30.00 barrier lies at the top of a four-year consolidation range.
- A breakout above would be a significant technical event for Silver.
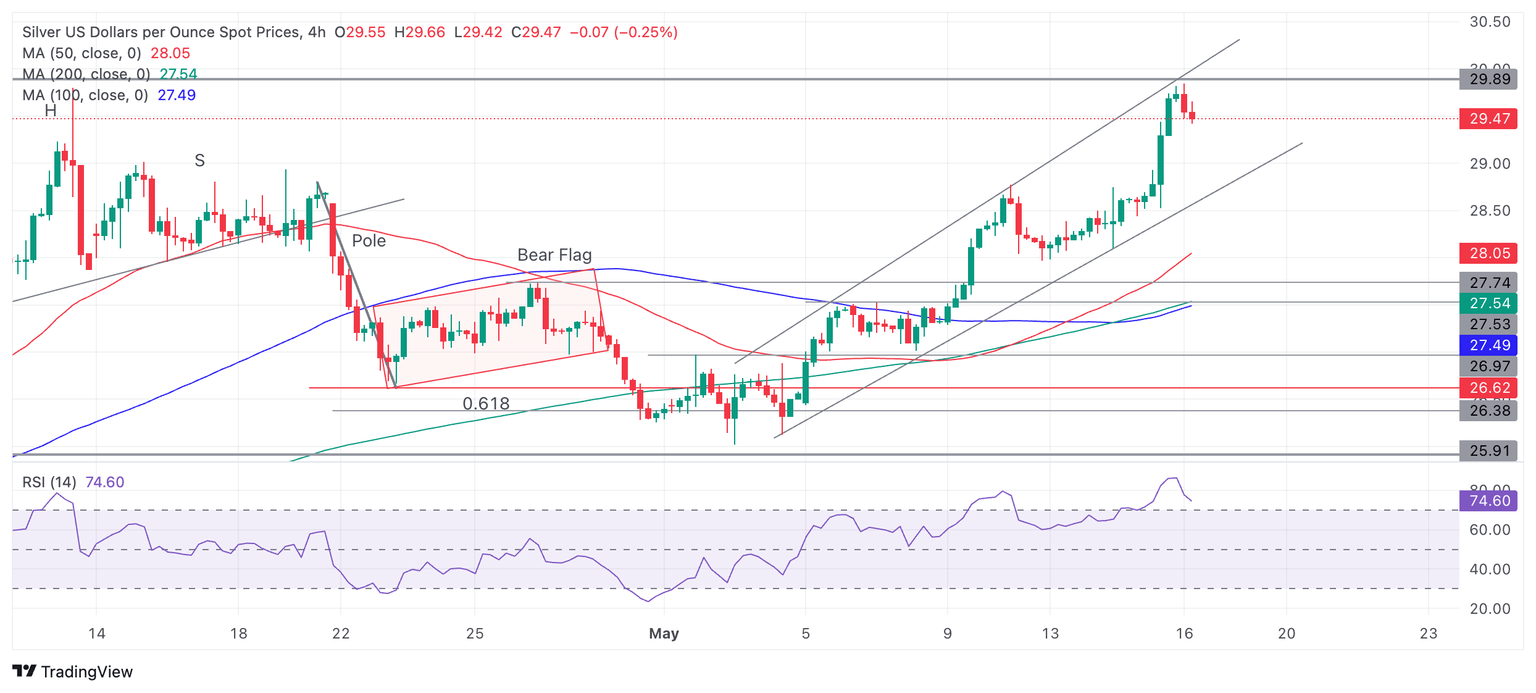
Silver (XAG/USD) price is rising up in an ascending channel and on Thursday reached just shy of the $30.00 mark, a significant resistance level.
The precious metal is currently pulling back as traders book profits, however, it remains in a short-term uptrend, which given the old saying that “the trend is your friend” is likely to resume and continue pushing higher.
4-hour Chart
The Relative Strength Index (RSI) is in the overbought zone, suggesting traders should be cautious about adding longs to their bullish positions. If the RSI exits overbought on a closing basis it will signal a deeper correction is taking place.
Eventually the short-term uptrend should reassert itself, however, and Silver price probably rally higher. Key long-term resistance for Silver lies at circa $30.00 which is likely to present a formidable barrier to further upside.
Silver Weekly Chart
The importance of the $30.00 level can be seen more clearly on the weekly chart above, which shows the level has repeatedly been tested since 2020 when Silver’s long-term sideways consolidation began.
This is the fourth time the level has been tested and it is possible that it will repel price once again, however, a decisive break above the level would probably lead to a volatile move higher. This is so because levels that have been repeatedly touched often generate volatile moves when they are finally penetrated.
A decisive break above $30.00, therefore, would result in an extension of the short-term uptrend and a breakout from a four-year consolidation range. At a minimum such a move ought to reach $32.28, the Fibonacci 0.618 extension of the upper part of the consolidation range higher. This is only an estimate, however, and there is a possibility Silver could go much higher as confidence in the uptrend draws more bulls to the trade. If exuberance is high, $33.83 could be reached, followed even by $36.28, the 1.618 ratio extension of the height of the range.
It would require a decisive break below the rising channel lows at roughly $29.00 to bring the short-term uptrend into doubt and suggest the possibility of a more bearish outlook.
A decisive break would be one accompanied by a long red candlestick that closed near its lows or three red candlesticks in a row.
Information on these pages contains forward-looking statements that involve risks and uncertainties. Markets and instruments profiled on this page are for informational purposes only and should not in any way come across as a recommendation to buy or sell in these assets. You should do your own thorough research before making any investment decisions. FXStreet does not in any way guarantee that this information is free from mistakes, errors, or material misstatements. It also does not guarantee that this information is of a timely nature. Investing in Open Markets involves a great deal of risk, including the loss of all or a portion of your investment, as well as emotional distress. All risks, losses and costs associated with investing, including total loss of principal, are your responsibility. The views and opinions expressed in this article are those of the authors and do not necessarily reflect the official policy or position of FXStreet nor its advertisers. The author will not be held responsible for information that is found at the end of links posted on this page.
If not otherwise explicitly mentioned in the body of the article, at the time of writing, the author has no position in any stock mentioned in this article and no business relationship with any company mentioned. The author has not received compensation for writing this article, other than from FXStreet.
FXStreet and the author do not provide personalized recommendations. The author makes no representations as to the accuracy, completeness, or suitability of this information. FXStreet and the author will not be liable for any errors, omissions or any losses, injuries or damages arising from this information and its display or use. Errors and omissions excepted.
The author and FXStreet are not registered investment advisors and nothing in this article is intended to be investment advice.
Recommended content
Editors’ Picks
AUD/USD: Outlook is still bearish below 0.6630
AUD/USD extended its gains from Wednesday, supported by continued selling pressure on the US Dollar. However, weak performance in the commodities market and disappointing Chinese PMI data limited the Australian dollar's upward potential.
EUR/USD extends upside above 1.0850, with all eyes on US NFP data
The EUR/USD pair extends the rally to 1.0885 during the early Asian session on Friday. The uptick of the major pair is bolstered by the weakening of the US Dollar. All eyes will be on the US Nonfarm Payrolls, which is due later on Friday.
Gold retreated sharply, trades around $2,740
Prices of Gold trade markedly on the defensive on Thursday following a marginal uptick in the Greenback and declining US yields. Despite the daily pullback, the yellow metal is anticipated to remain bolstered by steady uncertainty pre-US election.
Maker Price Forecast: MKR could stage 40% rally
MakerDAO is up 2% on Thursday and could be set for a 40% rise in the coming weeks if it successfully maintains an extended move above the descending trendline of a falling wedge. On-chain data also supports the bullish outlook after a four-month-long decline.
Bank of Japan holds rates steady amid signs of modest GDP growth
Monthly industrial production results have been mixed but generally indicate a modest recovery in third-quarter GDP. Clear guidance from the Bank of Japan remains elusive, with each upcoming meeting being pivotal.
Best Forex Brokers with Low Spreads
VERIFIED Low spreads are crucial for reducing trading costs. Explore top Forex brokers offering competitive spreads and high leverage. Compare options for EUR/USD, GBP/USD, USD/JPY, and Gold.