Silver Price Analysis: Key EMAs prod XAG/USD bulls at three-week high near $22.00


  • Silver price eases around monthly top after rising the most since early November 2022.
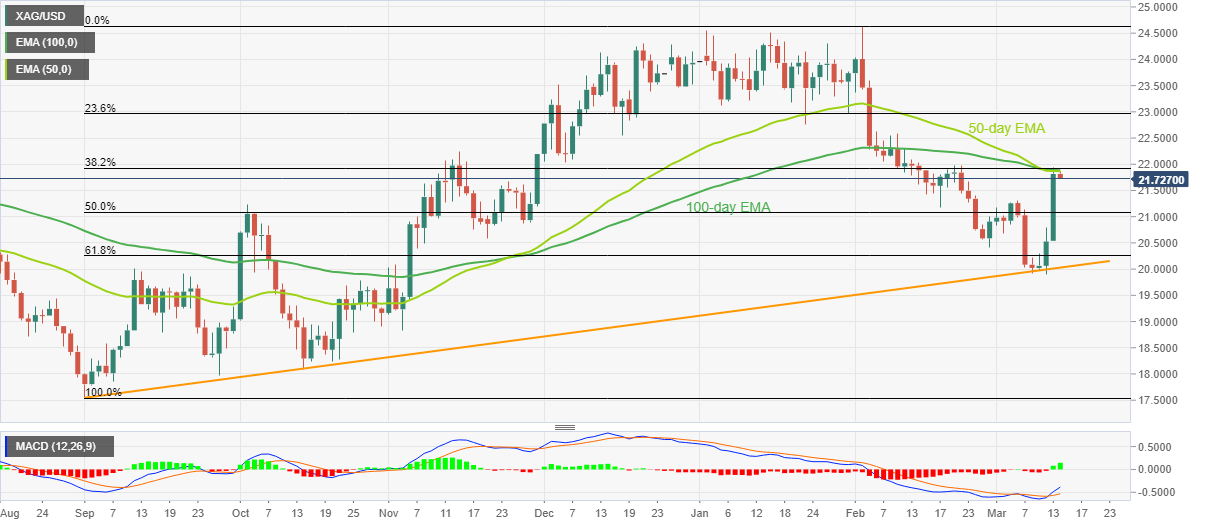
  • Convergence of 50-day, 100-day EMAs challenge XAG/USD bulls.
  • Bullish MACD signals, sustained bounce off multi-day-old support line keep Silver buyers hopeful.

Silver price (XAG/USD) slides to around $21.70 as bulls take a breather following the biggest daily jump in more than four months. With this, the bright metal traces the Gold price while probing XAG/USD bulls ahead of the key US inflation data.

Also read: Gold Price Forecast: XAU/USD retreats on sluggish Treasury yields ahead of United States inflation

That said, a convergence of the 50-day and the 100-day Exponential Moving Average (EMA) challenges the immediate upside of the Silver price near $21.90. Adding strength to the stated resistance is the 38.2% Fibonacci retracement level of the metal’s run-up from September 2022 to February 2023.

It should, however, be noted that the XAG/USD rebound from the 5.5-month-old upward-sloping trend line, around $20.00 by the press time, joins the bullish MACD signals to keep the Silver buyers hopeful.

Given the quote’s successful break of the $21.90 hurdle, as well as sustained trading beyond the 22.00 round figure, Silver bulls can aim for the 23.6% Fibonacci retracement level surrounding $23.00. Following that, a rally toward the 2023 peak surrounding $24.65 can’t be ruled out.

On the contrary, the Silver price pullback can aim for the 50% and 61.8% Fibonacci retracements, respectively near $21.10 and $20.25 at the latest, before challenging the previously mentioned multi-day-old support line, close to $20.00 by the press time.

It’s worth observing, though, that the XAG/USD weakness below $20.00 could make it vulnerable to testing the November 2022 low of near $18.80. During the fall, the monthly bottom surrounding $19.90 can act as a validation point.

Silver price: Daily chart

Trend: Further upside expected

Additional important levels

Overview
Today last price 21.82
Today Daily Change 0.00
Today Daily Change % 0.00%
Today daily open 21.82
 
Trends
Daily SMA20 21.12
Daily SMA50 22.47
Daily SMA100 22.22
Daily SMA200 20.94
 
Levels
Previous Daily High 21.93
Previous Daily Low 20.54
Previous Weekly High 21.31
Previous Weekly Low 19.9
Previous Monthly High 24.64
Previous Monthly Low 20.42
Daily Fibonacci 38.2% 21.4
Daily Fibonacci 61.8% 21.07
Daily Pivot Point S1 20.93
Daily Pivot Point S2 20.04
Daily Pivot Point S3 19.54
Daily Pivot Point R1 22.32
Daily Pivot Point R2 22.82
Daily Pivot Point R3 23.7


Share: Feed news

Information on these pages contains forward-looking statements that involve risks and uncertainties. Markets and instruments profiled on this page are for informational purposes only and should not in any way come across as a recommendation to buy or sell in these assets. You should do your own thorough research before making any investment decisions. FXStreet does not in any way guarantee that this information is free from mistakes, errors, or material misstatements. It also does not guarantee that this information is of a timely nature. Investing in Open Markets involves a great deal of risk, including the loss of all or a portion of your investment, as well as emotional distress. All risks, losses and costs associated with investing, including total loss of principal, are your responsibility. The views and opinions expressed in this article are those of the authors and do not necessarily reflect the official policy or position of FXStreet nor its advertisers. The author will not be held responsible for information that is found at the end of links posted on this page.

If not otherwise explicitly mentioned in the body of the article, at the time of writing, the author has no position in any stock mentioned in this article and no business relationship with any company mentioned. The author has not received compensation for writing this article, other than from FXStreet.

FXStreet and the author do not provide personalized recommendations. The author makes no representations as to the accuracy, completeness, or suitability of this information. FXStreet and the author will not be liable for any errors, omissions or any losses, injuries or damages arising from this information and its display or use. Errors and omissions excepted.

The author and FXStreet are not registered investment advisors and nothing in this article is intended to be investment advice.

Recommended content


Recommended content

Editors’ Picks

EUR/USD clings to gains above 1.0850 after US inflation data

EUR/USD clings to gains above 1.0850 after US inflation data

EUR/USD trades in positive territory above 1.0850 in the American session on Friday. The US Dollar struggles to preserve its strength following the April PCE inflation data and helps the pair hold its ground heading into the weekend.

EUR/USD News

GBP/USD retreats from 1.2765, holds on to modest gains

GBP/USD retreats from 1.2765, holds on to modest gains

GBP/USD posted a two-day high peat at 1.2765 in the American session, as US data showed that the core PCE inflation held steady at 2.8% on a yearly basis in April. The pair retreated afterwards as risk aversion triggered US Dollar demand.

GBP/USD News

Gold falls towards $2,330 as the mood sours

Gold  falls towards $2,330 as the mood sours

US inflation-related data took its toll on financial markets. Wall Street turned south after the opening and without signs of easing price pressures in the world’s largest economy. The US Dollar takes the lead in a risk-averse environment.

Gold News

Here’s why Chainlink price could crash 15% despite spike in social volume Premium

Here’s why Chainlink price could crash 15% despite spike in social volume

Chainlink price has flashed multiple sell signals after its recent climb, hinting at a short-term correction. This signal comes despite a double-digit growth in its social volume. LINK bulls need to exercise caution as this forecast is backed by on-chain metrics.

Read more

Week ahead – ECB rate cut might get eclipsed by BoC surprise and NFP report

Week ahead – ECB rate cut might get eclipsed by BoC surprise and NFP report

ECB set to slash rates on Thursday, focus on forward guidance. But will the BoC take the lead when it meets on Wednesday? US jobs report eyed on Friday as Fed unyielding on cuts. OPEC+ might extend some output reductions into 2025.

Read more

Forex MAJORS

Cryptocurrencies

Signatures