Here’s why Chainlink price could crash 15% despite spike in social volume
- Chainlink price could reverse after a 50% rally.
- Technicals and on-chain metrics suggest the recent gains might come undone.
- Investors can accumulate LINK between $15 and $14, assuming the long-term bullish trend remains intact.
- A decisive daily candlestick close above $20 would invalidate the bearish thesis.

Chainlink (LINK) price has flashed multiple sell signals after its recent climb, hinting at a short-term correction. This signal comes despite a double-digit growth in its social volume. LINK bulls need to exercise caution as this forecast is backed by on-chain metrics.
 [18.50.03, 30 May, 2024]-638526720184753144.png)
LINK Social Volume
Also read: Week Ahead: Checking the health of Bitcoin’s bull run
Chainlink price needs to slowdown
Chainlink price has shot up nearly 50% between May 15 and 30, creating a short-term range extending from $12.84 to $19.21. This massive uptrend shows signs of exhaustion as it sets up a bearish divergence.
A bearish divergence is formed when the price produces a higher high while the momentum indicator, in this case, the Relative Strength Index (RSI), produces a lower high. This non-conformity is a signal of the waning bullish momentum and forecasts a reversal or a short-term correction.
Additionally, investors should note that Chainlink price currently trades at roughly $18, which coincides with two critical hurdles:
- The Volume Profile’s highest traded volume level at roughly $18.
- The daily resistance level, which is also at present around $18. This level was a key support structure between early February and late March. Hence, overcoming this hurdle will not be an easy task for already exhausted bulls.
Considering the above observations, the probability of a retracement for LINK is logical. However, investors should note that attempting to short Chainlink’s price is a risky endeavor due to the volatile nature of the markets.
The potential correction noted above could knock LINK down by 15% to the first key support level of $16.02. This barrier is the midpoint of the $12.84 to $19.21 range. If this point does not deplete the selling pressure, the Oracle token could drop into the daily imbalance, stretching from $13.93 to $15.47.
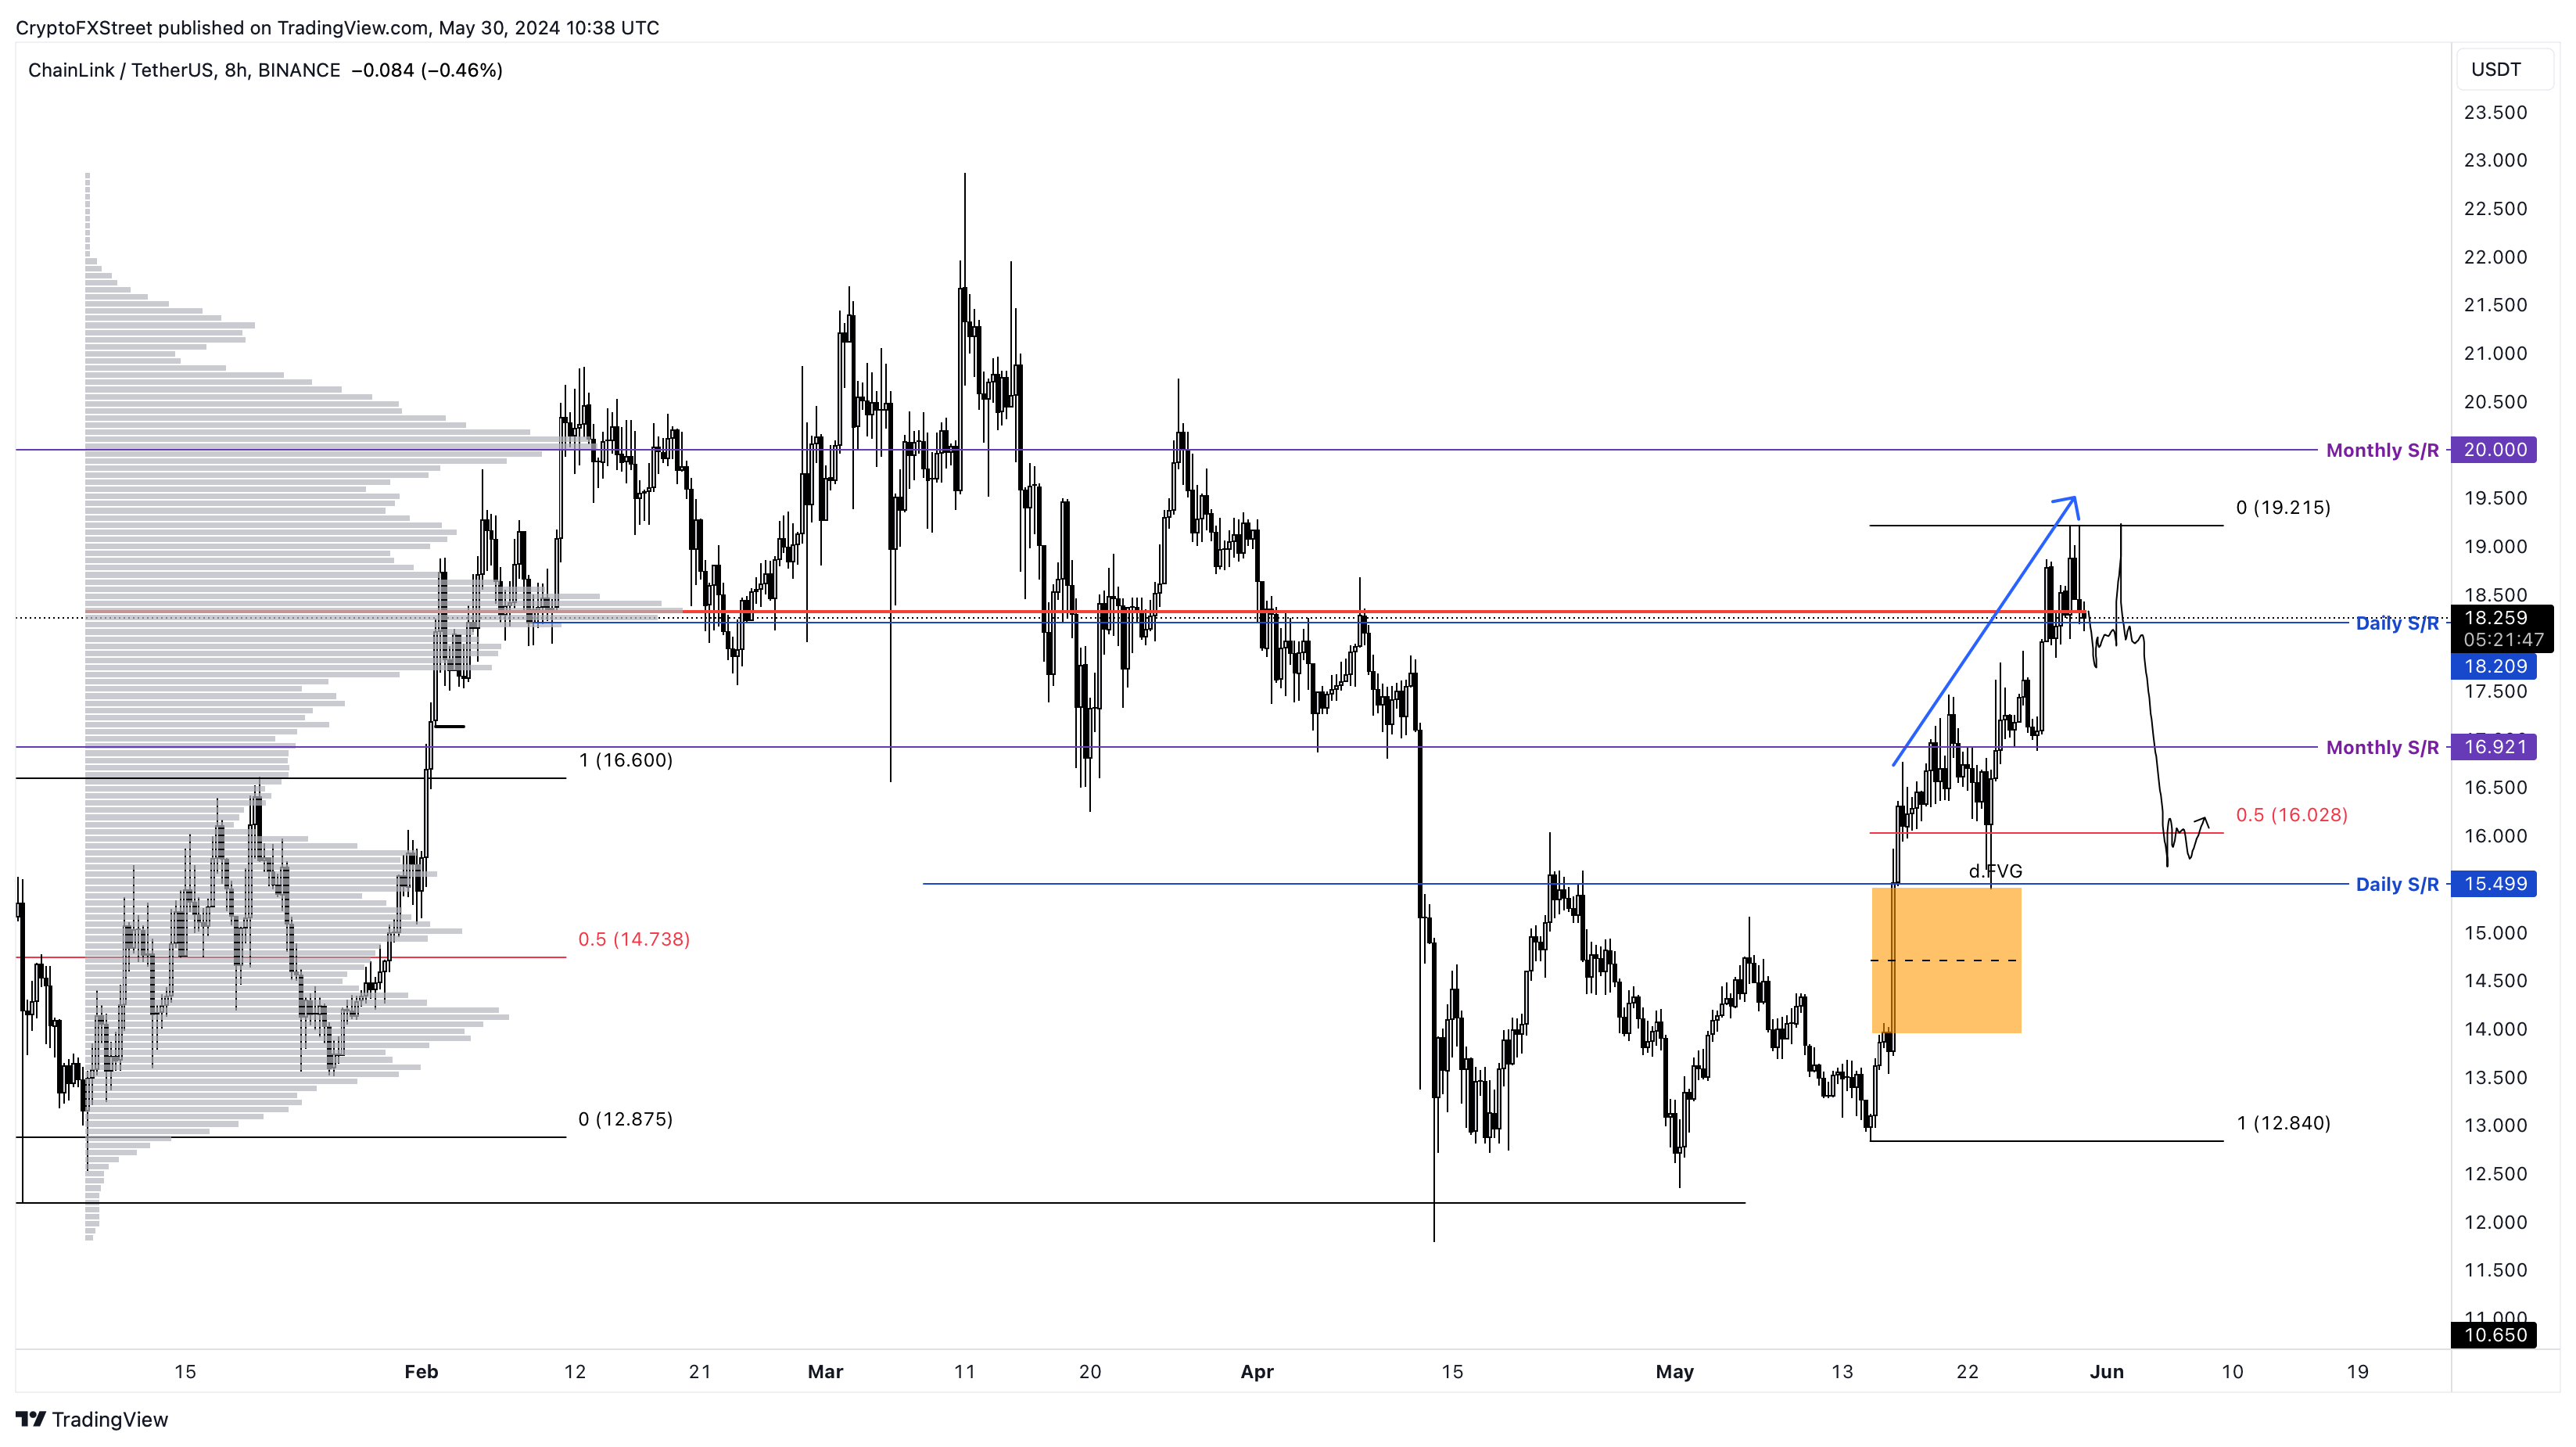
LINK/USDT 8-hour chart
Read more: Chainlink could provide buying opportunity before 50% rally
LINK's on-chain metrics support correction
The short-term bearish outlook forecasted from a technical perspective coincides well with what on-chain data shows.
The Network Growth data from Santiment shows a divergence similar to the one noted above. This index tracks the new addresses joining the Chainlink blockchain and can be interpreted as capital inflow and interest in LINK investors. However, the new addresses plummeted 22% from mid-March to May 30, showing that the 50% rally noted in the past two weeks was driven by fumes and not actual momentum.
 [16.35.22, 30 May, 2024]-638526717836819076.png)
LINK Network Growth
According to Santiment’s 30-day Market Value to Realized Value (MVRV) indicator, LINK has flashed a sell signal. Historically, when the 30-day MVRV has hit between 13% and 20%, Chainlink price has formed a local top. Right now, this index currently hovers around 15% from 21% in the last three days.
The 15% value suggests that investors who purchased LINK in the past month are currently sitting at an average profit of 15%. The unrealized gains could quickly become a source of selling pressure, triggering a correction for the Oracle token.
 [16.36.12, 30 May, 2024]-638526718024469022.png)
LINK 30-day MVRV
Lastly, the Whale Transaction Count metric, which tracks transfers worth $100,000 or more, has also spiked recently, signaling a potential correction. This index serves as a proxy for institutional investors and can be used as a buy or sell signal, depending on the market's nature.
For example, the $100,000 or higher transfers spike on March 11 marked a top to the 70% rally witnessed between January 25 and March 11. On the contrary, the April 11 uptick that occurred after a 27% crash was a clear buy signal. The ongoing growth in whale transactions has happened after a 50% rally, which could suggest that a reversal is likely.
 [16.37.46, 30 May, 2024]-638526718297194973.png)
LINK Whale Transaction Count
Although Chainlink price shows a short-term bearish outlook, investors need to be cautious of the bearish divergence. This technical formation could be undone if the general market outlook flips bullish. In such a case, LINK could overcome the range high of $19.21 and retest the $20 psychological level. Since this hurdle coincides with Volume Profile’s high volume node, a breakout above it will invalidate the bearish outlook.
This flip of $20 into a support floor, on the daily or higher timeframe, will signal that bulls have overcome a critical level and are ready to tackle the local top formed at $22.86 on March 11.
Author

Akash Girimath
FXStreet
Akash Girimath is a Mechanical Engineer interested in the chaos of the financial markets. Trying to make sense of this convoluted yet fascinating space, he switched his engineering job to become a crypto reporter and analyst.


