|

Silver Price Analysis: Forms Triangle or Bull Pennant within a Measured Move

  • Silver is forming a Symmetrical Triangle, or Bull Pennant continuation pattern with bullish implications for price. 
  • It is also probably rising up in the final wave C of a Measured Move price pattern, also with bullish expectations. 
  • MACD is poised to rise higher after crossing the zero-line.

Silver (XAG/USD) has formed a price pattern after its recent rally, which saw it break out of its falling channel. 

The price pattern could either be a Symmetrical Triangle (ST) pattern, or perhaps a Bull Pennant continuation pattern; the first has slightly bullish connotations, the second has stronger bullish implications. 

Silver Daily Chart

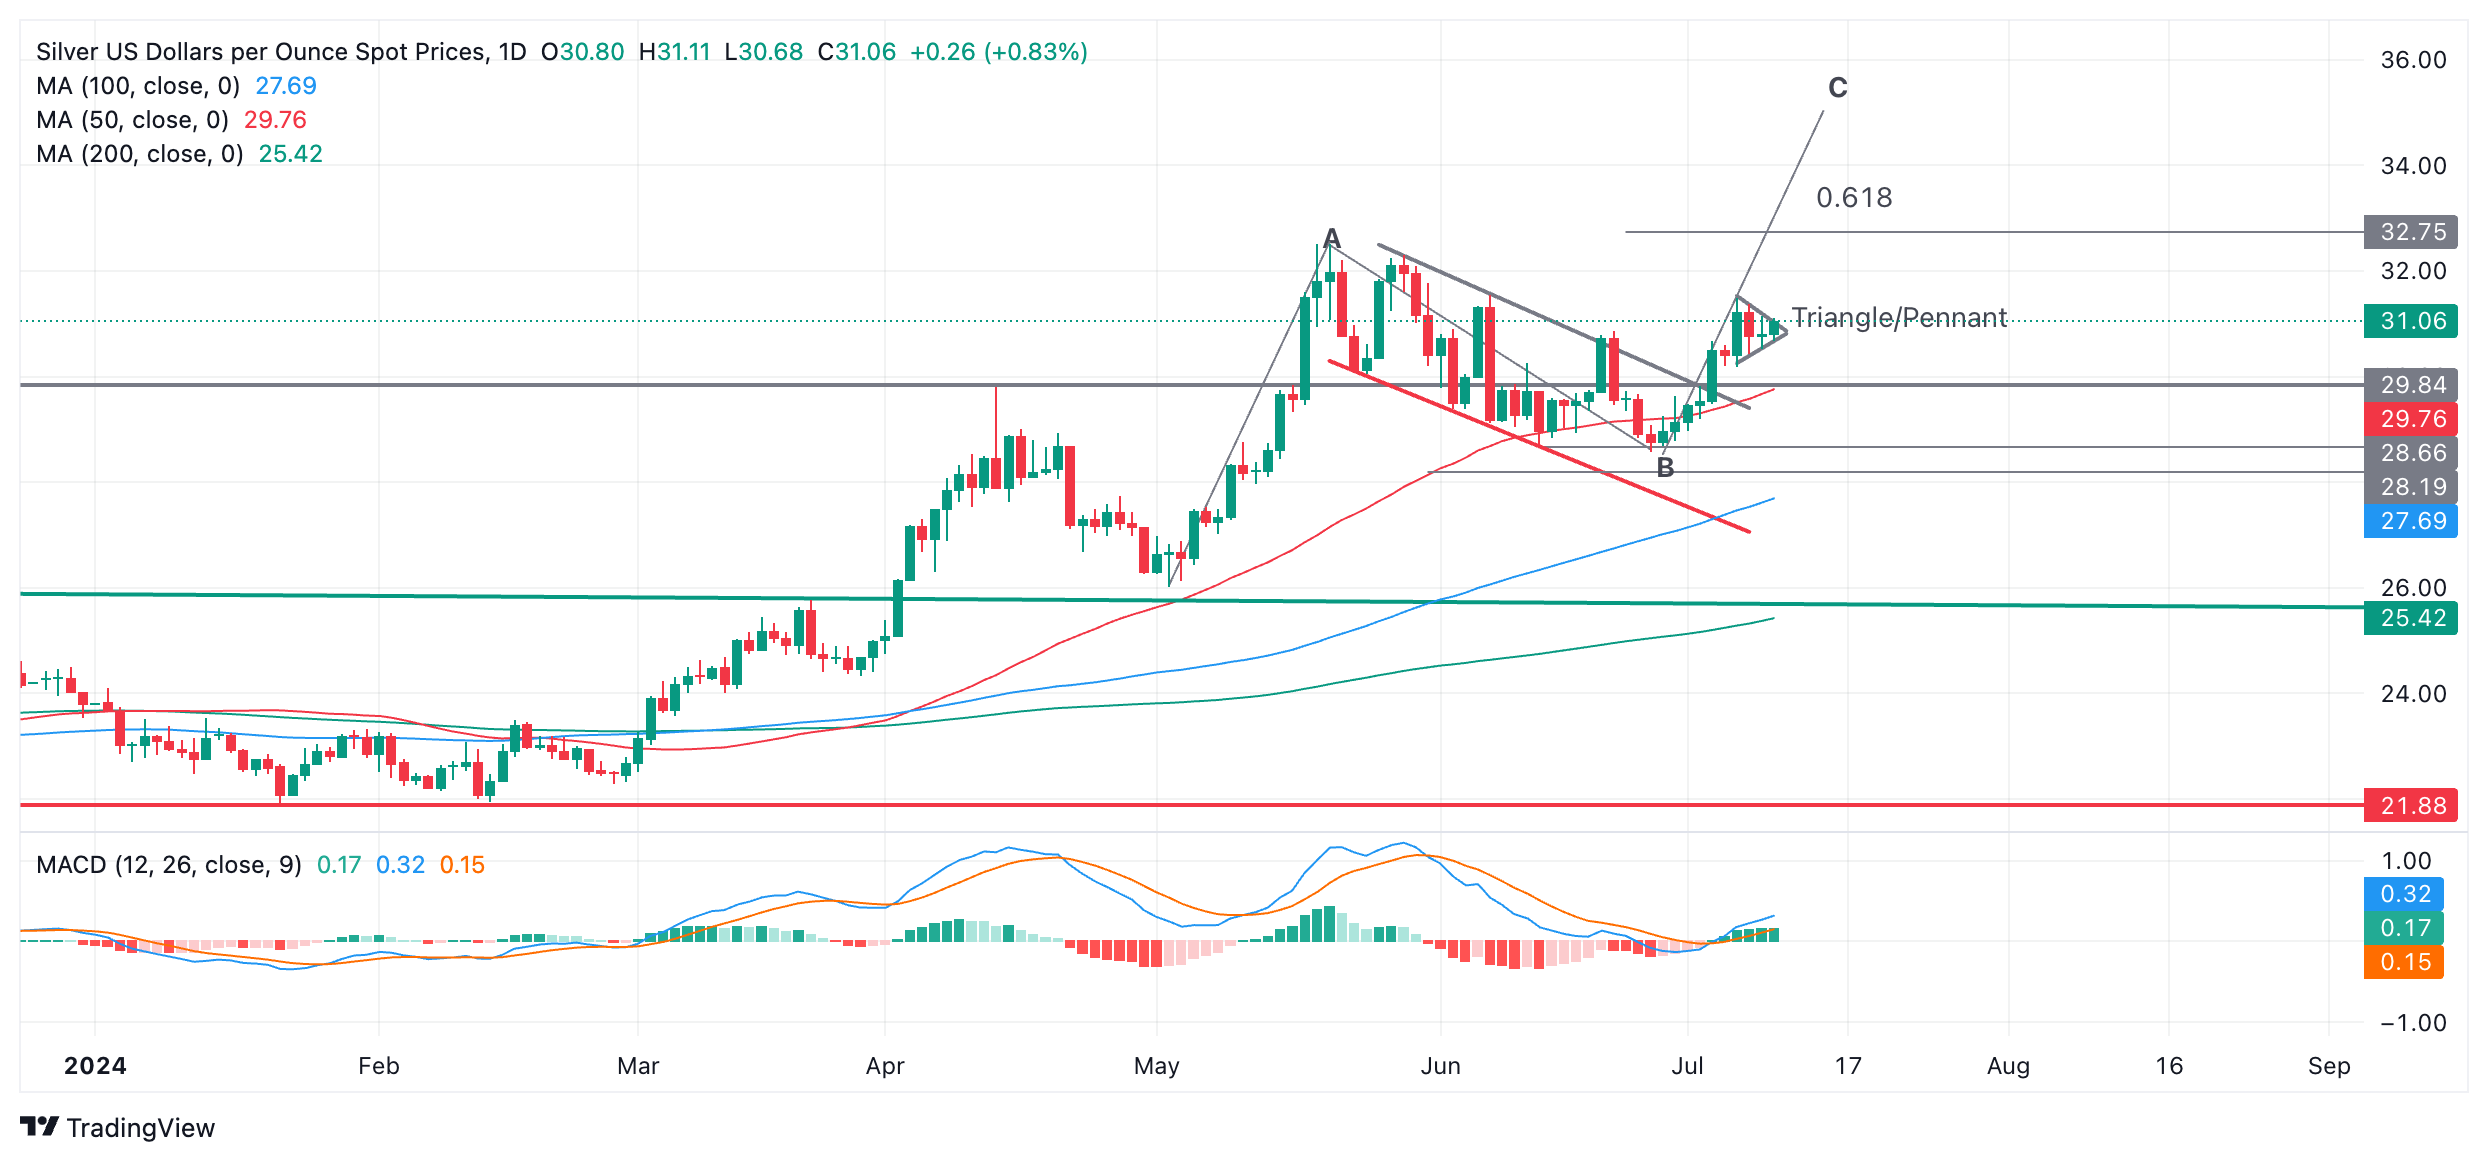
More broadly Silver is also probably in the process of rising up in the final wave C of a three-wave Measured Move (MM), with a final price target substantially higher than the current market level.

STs do not give a hint of the direction of the breakout but it is usually in the direction of the prior trend. Bull Pennants, however, are bullish and strongly suggest higher prices to come. 

MMs are like large zig-zags composed of three waves, sometimes labeled A,B and C.  

As Silver price is currently rising up in wave C it is likely to go higher, either till it reaches the end of wave C or, more conservatively $32.75 ( calculated as the 0.618 extrapolation of wave A). If it reaches the end of C it could rally to $35.00. 

A break above the top of the ST/Pennant at $31.49 would provide confirmation of the next leg higher. 

The Moving Average Convergence Divergence (MACD) momentum indicator has crossed above the zero line and looks poised to continue higher, with bullish implications for price. 

Author

Joaquin Monfort

Joaquin Monfort is a financial writer and analyst with over 10 years experience writing about financial markets and alt data. He holds a degree in Anthropology from London University and a Diploma in Technical analysis.

More from Joaquin Monfort
Share:

Editor's Picks

AUD/USD regains mild traction, falters near 0.7150

AUD/USD gathers some steam and manages to flirt with the 0.7150 level on Thursday. However, the pair has retraced some of Wednesday’s significant pullback due to renewed selling pressure on the Greenback and a slight improvement in risk sentiment following hopes of a deal in the Middle East. Wrapping up the Australian docket, the RBA’s Hauser will speak early on Friday.

USD/JPY trades below 160.00 intervention threshold; bullish bias intact

The USD/JPY pair attracts some sellers during the Asian session amid fears that authorities will step in again to prop up the Japanese Yen. Furthermore, the Israel-Lebanon truce prompts some profit-taking around the US Dollar and exerts downward pressure on the currency pair.

Gold puts its 200-day SMA to the test near $4,420

Gold keeps the bullish stance in place in the latter part of Thursday’s session, although a convincing break above the key $4,500 mark per troy ounce still remains elusive. The precious metal’s advance comes amid the resurgence of some selling interest around the Greenback, improving risk sentiment, and declining US Treasury yields across the board.

XRP plummets as ETF outflows, geopolitical tensions reinforce bearish outlook
Ripple (XRP) edges lower, trading around $1.15 at the time of writing on Thursday, its lowest price since February 6. The cross-border money remittance token is extending the sell-off for the fifth consecutive day, reflecting persistent headwinds from ongoing geopolitical tensions and investor uncertainty.
Nonfarm payrolls: Testing the limits of Fed policy patience

The upcoming nonfarm payrolls report for May will provide the final update on the US labor market before Kevin Warsh attends his first policy meeting as the new Fed Chair later this month.

Recession on paper: What really moves the Canadian Loonie now?

Statistics Canada handed the headline writers a gift and the analysts a headache. Real GDP shrank 0.1% on an annualized basis in the first quarter, and with the fourth quarter of 2025 revised down to a 1.0% contraction, that is two negative quarters in a row, the textbook definition of a technical recession and Canada's first since the pandemic.