|

Silver Price Analysis: Daily bullish extension on the cards

  • Silver is testing a critical area of supply on the monthly chart.
  • The daily chart is, however, offering a meanwhile bullish continuation opportunity. 

The bulls are in charge of the monthly and weekly time frames and the daily advance is riding the 10-EMA for a portable test and penetration of daily resistance for the forthcoming sessions. 

Monthly chart

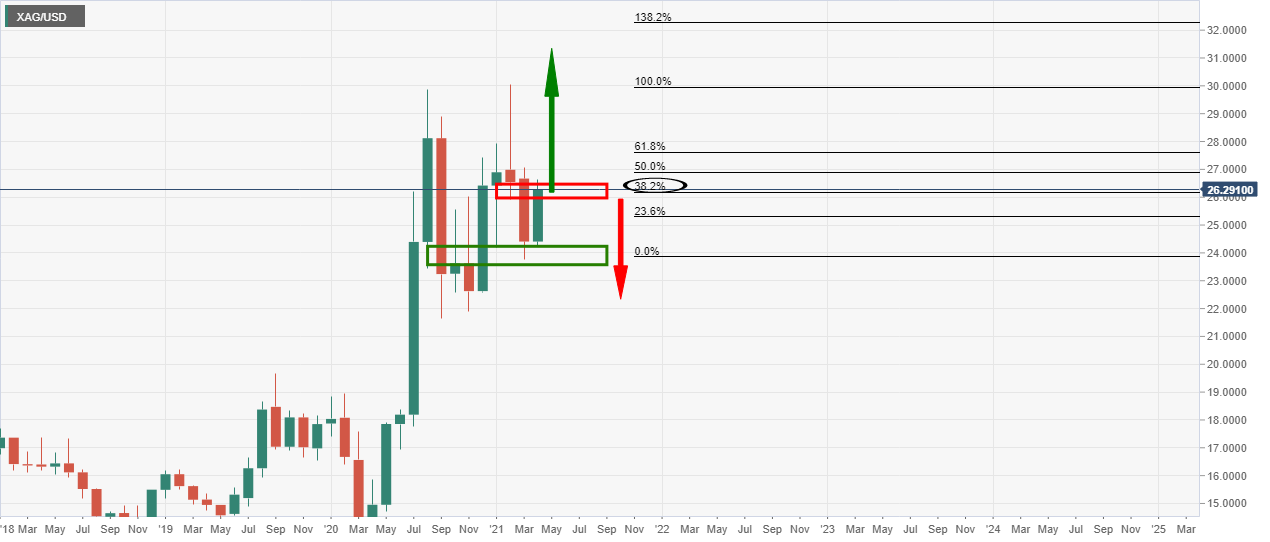
The monthly chart is bullish on a break of the 38.2% Fibonacci confluence and resistance, but it will be otherwise trapped on failures there, offering scope to downside opportunities on the lower time frames. 

Weekly chart

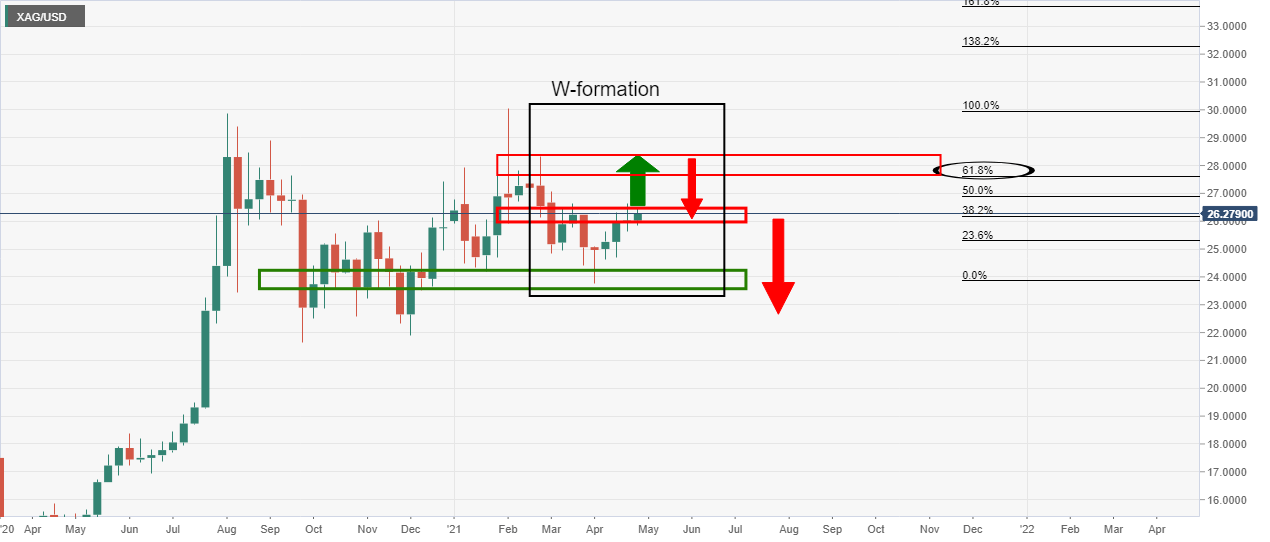
The weekly chart's W-formation is compelling and argues for an upside extension to test prior highs at a 61.8% Fibonacci confluence prior to a correction back to test old resistance that would be expected to turn to support.

This leaves the daily outlook potentially bullish, so let's move down to the daily chart to take a look...

Daily chart

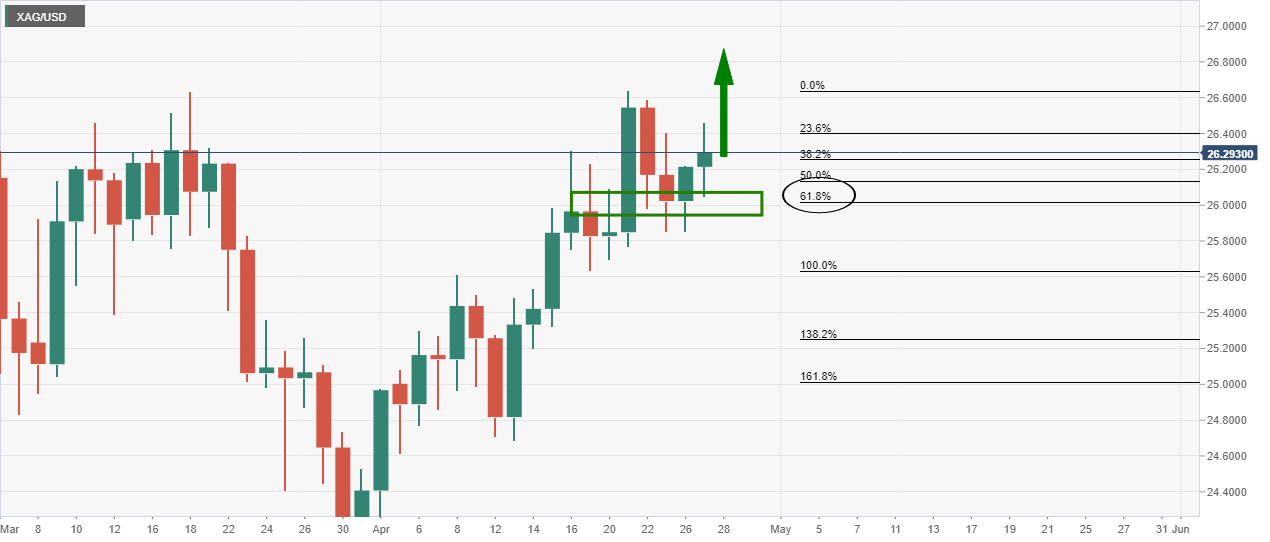
Indeed, the price is moving higher from support at the 61.8% Fibonacci retracement of the prior bullish impulse. 

The 4-hour time frame can be monitored for bullish structure from where bulls might wish to engage to target a higher high on the daily chart and deeper penetration of both monthly and weekly resistances.  

4-hour chart

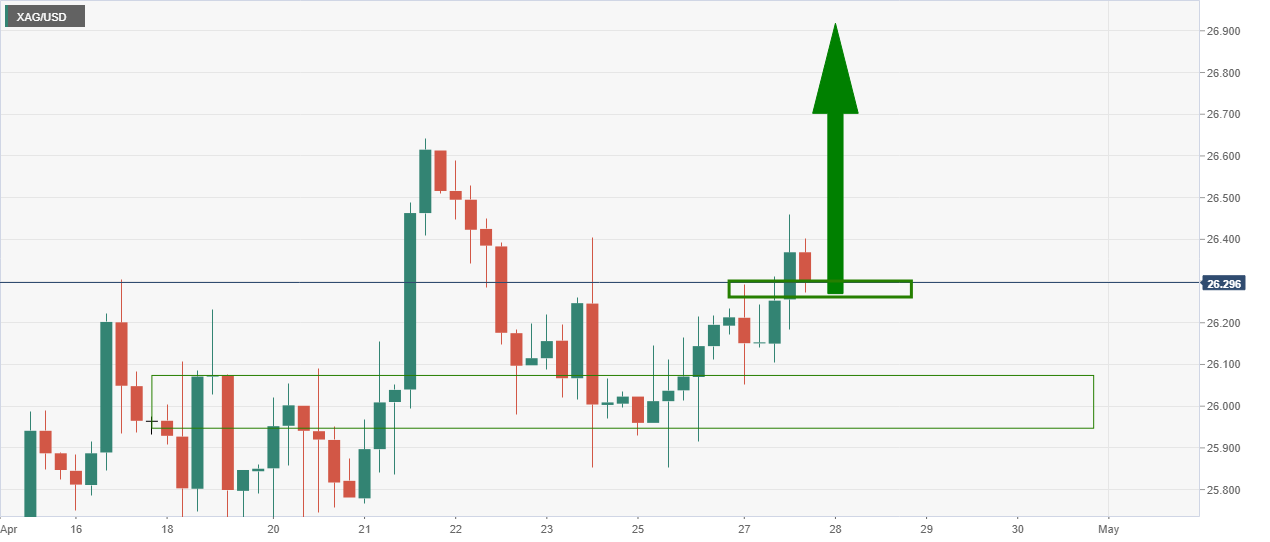
The 4-hour chart has corrected back to test an old resistance from which offers a bullish prospect and discount for the bulls to engage and target a bullish continuation on the daily time frame. 

Author

Ross J Burland

Ross J Burland, born in England, UK, is a sportsman at heart. He played Rugby and Judo for his county, Kent and the South East of England Rugby team.

More from Ross J Burland
Share:

Editor's Picks

AUD/USD falls to near 0.7100 after slipping below 50-day EMA

AUD/USD depreciates after registering minor gains in the previous day, trading around 0.7120 during the Asian hours. The technical analysis of the daily chart shows the pair consolidating sideways within a rectangle pattern, as neither bulls nor bears gain control. The AUD/USD pair is holding a slight bearish tone however as it sits beneath both the nine-day and 50-day EMAs.

160.00: USD/JPY back near intervention territory after upbeat US jobs report

US Nonfarm Payrolls beat expectations by a wide margin in May, with 172K jobs added. The US Dollar rebounds after the release, helping USD/JPY recover from its intraday lows. Warnings from Japanese authorities continue to limit upside potential near the 160.00 threshold.

Gold remains offered below $4,500 following US Payrolls

Gold prices trade with a bearish bias and still remain below the key $4,500 mark per troy ounce at the end of the week. The slighlty softer tone in the US Dollar alongside mixed US Treasury yields across the curve also keep the yellow metal’s downside somewhat contained.


Cardano hits five-year low even as Hoskinson clarifies "break" isn't an exit

Cardano (ADA) price is down 10% at press time on Friday, extending losses over 30% so far this week amid Charles Hoskinson's clarification that "break" isn't an exit.

Week ahead – Fed countdown begins amid US inflation data and geopolitical risks

Fed Chair Warsh’s first meeting approaches as key US inflation data could reshape expectations. Oil prices remain elevated as US-Iran talks continue; tariffs also return to the spotlight. ECB is expected to hike; will it be a one-off move or is July live?

The US economy defies the rules: 100 days into the Oil shock and the recession signal is still missing

More than three months after the start of the Iran war and the resulting disruption to global energy markets, the US economy continues to display remarkable resilience. The conflict has triggered a sharp rise in Oil prices, reignited inflationary pressures and fueled widespread concerns about a potential economic slowdown.