Pound Sterling gains ground ahead of US core PCE inflation
- The Pound Sterling rises against the US Dollar but the overall direction remains uncertain.
- Economists expect that the US core PCE inflation softened in May.
- The uncertainty over the UK elections outcome keeps the Pound Sterling on its toes.

The Pound Sterling (GBP) finds a cushion above the round-level support of 1.2600 against the US Dollar (USD) in Thursday’s New York session. The GBP/USD pair gauges ground as the US Dollar registers a modest correction. The US Dollar Index (DXY), which tracks the Greenback’s value against six major currencies, edges down after posting a fresh eight-week high near 106.10.
However, the near-term outlook of the US Dollar remains firm as investors are expected to trade cautiously ahead of the United States (US) core Personal Consumption Expenditure price index (PCE) data for May, which will be published on Friday. Core PCE inflation, the Federal Reserve’s (Fed) preferred inflation measure, is estimated to grow at a slower pace of 0.1% against 0.2% in April month-on-month. Annually, the underlying inflation is projected to decelerate to 2.6% from 2.8% in April.
A scenario in which PCE inflation declines, as economists expect, would boost expectations for the Fed to begin reducing interest rates from September. According to the CME FedWatch tool, traders see a 62.3% that interest rates will be reduced from their current levels. The tool also shows that the Fed will cut interest rates twice this year. However, Fed policymakers signaled in their latest dot plot that there will be only on rate cut this year.
On the economic data front, Initial Jobless Claims data for the week ending June 21 were lower than projected, and the Durable Goods Orders unexpectedly expanded in Thursday's American session. The US Department of Labor showed that individuals claiming jobless benefits were lower at 233K than estimates of 236K and the prior release of 238K. Durable Goods Orders rose at a meager growth of 0.1%. Economists forecasted them to have declined by 0.1% after an expansion of 0.6%, downwardly revised from 0.7%.
Daily digest market movers: Pound Sterling underperforms against Asian peers
- The Pound Sterling gains against its European peers and the US Dollar but is weak against Asian currencies in Thursday’s European session. In Asia, the Japanese Yen (JPY) rises as fears of Japan’s intervention in the FX domain have intensified. Meanwhile, antipodean currencies are showing strength as investors expect that the Reserve Bank of Australia (RBA) and the Reserve Bank of New Zealand (RBNZ) will not pivot to policy normalization this year.
- The British currency is expected to face volatility as the United Kingdom (UK) parliamentary elections are held on July 4. According to polls, UK Prime Minister Rishi Sunak’s Conservative Party is expected to suffer a defeat from the opposition Labour Party.
- On the economic front, the deteriorating economic outlook due to the Bank of England's (BoE) higher interest rates and stubborn wage growth keep policymakers concerned. The preliminary S&P Global/CIPS Purchasing Managers’ Index (PMI) for June showed that business activity in the manufacturing sector expanded at a faster pace, while operations in the service sector unexpectedly slowed. Meanwhile, high wage growth continues to empower individuals with high purchasing power, making it more difficult for policymakers to kick-start the policy-easing cycle.
- Financial markets expect the BoE to start reducing interest rates from the August meeting. Meanwhile, investors will focus on the revised UK Q1 GDP estimates, which will be published on Friday.
Pound Sterling Price Today:
British Pound PRICE Today
The table below shows the percentage change of British Pound (GBP) against listed major currencies today. British Pound was the strongest against the US Dollar.
| GBP | USD | EUR | JPY | CAD | AUD | NZD | CHF | |
|---|---|---|---|---|---|---|---|---|
| GBP | 0.16% | 0.03% | -0.02% | 0.06% | -0.11% | -0.01% | 0.11% | |
| USD | -0.16% | -0.13% | -0.21% | -0.11% | -0.30% | -0.19% | -0.05% | |
| EUR | -0.03% | 0.13% | -0.10% | 0.00% | -0.17% | -0.09% | 0.06% | |
| JPY | 0.02% | 0.21% | 0.10% | 0.12% | -0.08% | -0.00% | 0.17% | |
| CAD | -0.06% | 0.11% | -0.01% | -0.12% | -0.21% | -0.09% | 0.04% | |
| AUD | 0.11% | 0.30% | 0.17% | 0.08% | 0.21% | 0.11% | 0.22% | |
| NZD | 0.01% | 0.19% | 0.09% | 0.00% | 0.09% | -0.11% | 0.13% | |
| CHF | -0.11% | 0.05% | -0.06% | -0.17% | -0.04% | -0.22% | -0.13% |
The heat map shows percentage changes of major currencies against each other. The base currency is picked from the left column, while the quote currency is picked from the top row. For example, if you pick the British Pound from the left column and move along the horizontal line to the US Dollar, the percentage change displayed in the box will represent GBP (base)/USD (quote).
Technical Analysis: Pound Sterling slides toward 200-day EMA
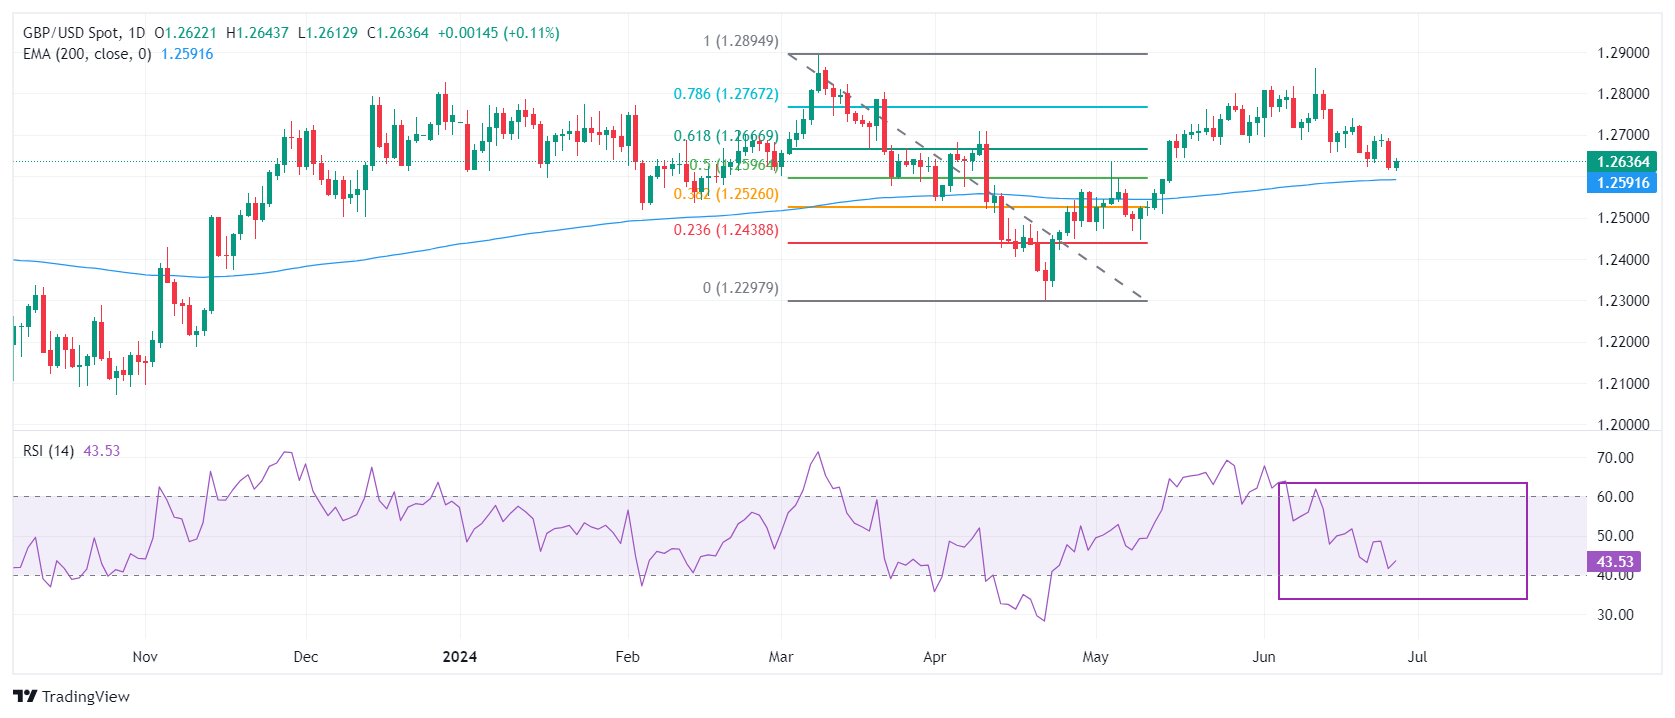
The Pound Sterling finds interim support near 1.2600 against the US Dollar. The GBP/USD pair has come under pressure after breaking below the crucial support of 1.2700. The Cable declines toward the 200-day Exponential Moving Average (EMA), which trades around 1.2590.
The Cable has dropped below the 61.8% Fibonacci retracement support at 1.2667, plotted from the March 8 high of 1.2900 to the April 22 low at 1.2300.
The 14-day Relative Strength Index (RSI) oscillates inside the 40.00-60.00 range, indicating consolidation ahead.
Economic Indicator
Initial Jobless Claims
The Initial Jobless Claims released by the US Department of Labor is a measure of the number of people filing first-time claims for state unemployment insurance. A larger-than-expected number indicates weakness in the US labor market, reflects negatively on the US economy, and is negative for the US Dollar (USD). On the other hand, a decreasing number should be taken as bullish for the USD.
Read more.Last release: Thu Jun 27, 2024 12:30
Frequency: Weekly
Actual: 233K
Consensus: 236K
Previous: 238K
Source: US Department of Labor
Every Thursday, the US Department of Labor publishes the number of previous week’s initial claims for unemployment benefits in the US. Since this reading could be highly volatile, investors may pay closer attention to the four-week average. A downtrend is seen as a sign of an improving labour market and could have a positive impact on the USD’s performance against its rivals and vice versa.
Author

Sagar Dua
FXStreet
Sagar Dua is associated with the financial markets from his college days. Along with pursuing post-graduation in Commerce in 2014, he started his markets training with chart analysis.


