Palantir Stock Forecast: PLTR completes best session performance of public company tenture
- PLTR garners 31% surge on back of terrific Q4 results.
- Palantir grew US commercial revenue by 70% YoY.
- Margins expand as revenue gains 20% from a year ago.
- Management raises full-year sales guidance.

Palantir (PLTR) stock appears to have turned a corner. On Tuesday it is worth nearly one-third more than it was on Monday after the big data firm shot up following successful fourth-quarter earnings results. PLTR stock closed up 30.8% at $21.87 following a slam dunk of an earnings release late Monday. Shares gave up less than 1% afterhours.
This performance was the best PLTR shareholders have ever seen. It outdid the former record from January 22, 2021, that saw a 25.4% gain.
A growing customer base and robust commercial revenue growth is making Palantir less reliant on government contracts. This shift is causing the market to swarm PLTR stock as it now looks more likely that Palantir has an extremely long growth ramp ahead.
All three major US indices gained on Tuesday as US Treasury yields sank. The Dow Jones added 0.37%, while the S&P 500 closed up 0.23%. The NASDAQ Composite rose 0.07%.
Palantir stock earnings news
Palantir saw revenue of $608.4 million in the fourth quarter, $5.6 million ahead of an already healthy Wall Street consensus. Revenue has grown nearly 20% from a year ago, and Palantir also met consensus for earnings with $0.08 in adjusted EPS (earnings per share).
Commercial revenue climbed 32% YoY to $284 million, but the real story is US-specific commercial revenue. That latter segment surged 70% YoY as Palantir’s offering on the artificial intelligence (AI) front exploded. US commercial customers rose 55% from a year ago.
Government revenue of $324 million rose 11% from a year ago, while total customer count for both the Government and Commercial segments rose 35%.
"[T]he AI Revolution is driving [AI Platform] deal flow to a level we did not expect until 2025," wrote Wedbush Securities analyst Dan Ives, who has a $25 price target on PLTR stock.
Even a notably skeptical analyst like Tyler Radke of Citi had to admit that Palantir had turned a corner. He raised his estimate of 2024 free cash flow by 55%.
Margins were the icing on the cake for Palantir. The company sports an adjusted free cash flow margin of 50%, an adjusted operating margin of 34%, and a GAAP profit margin of 15%.
Despite Q1 sales guidance that was slightly below consensus, Palantir raised the full-year forecast to between $2.652 billion and $2.66 billion.
S&P 500 FAQs
What is the S&P 500?
The S&P 500 is a widely followed stock price index which measures the performance of 500 publicly owned companies, and is seen as a broad measure of the US stock market. Each company’s influence on the computation of the index is weighted based on market capitalization. This is calculated by multiplying the number of publicly traded shares of the company by the share price. The S&P 500 index has achieved impressive returns – $1.00 invested in 1970 would have yielded a return of almost $192.00 in 2022. The average annual return since its inception in 1957 has been 11.9%.
How are companies chosen to be included in the S&P 500?
Companies are selected by committee, unlike some other indexes where they are included based on set rules. Still, they must meet certain eligibility criteria, the most important of which is market capitalization, which must be greater than or equal to $12.7 billion. Other criteria include liquidity, domicile, public float, sector, financial viability, length of time publicly traded, and representation of the industries in the economy of the United States. The nine largest companies in the index account for 27.8% of the market capitalization of the index.
How can I trade the S&P 500?
There are a number of ways to trade the S&P 500. Most retail brokers and spread betting platforms allow traders to use Contracts for Difference (CFD) to place bets on the direction of the price. In addition, that can buy into Index, Mutual and Exchange Traded Funds (ETF) that track the price of the S&P 500. The most liquid of the ETFs is State Street Corporation’s SPY. The Chicago Mercantile Exchange (CME) offers futures contracts in the index and the Chicago Board of Options (CMOE) offers options as well as ETFs, inverse ETFs and leveraged ETFs.
What factors drive the S&P 500?
Many different factors drive the S&P 500 but mainly it is the aggregate performance of the component companies revealed in their quarterly and annual company earnings reports. US and global macroeconomic data also contributes as it impacts on investor sentiment, which if positive drives gains. The level of interest rates, set by the Federal Reserve (Fed), also influences the S&P 500 as it affects the cost of credit, on which many corporations are heavily reliant. Therefore, inflation can be a major driver as well as other metrics which impact the Fed decisions.
Palantir stock forecast
Before Tuesday’s new range high, Palantir stock was in a technical, short-term downtrend. This is because PLTR shares had been trending lower ever since hitting a range high at $21.85 on November 21 of last year.
The surge in the PLTR stock price will now give bulls hope for retesting the high-volume zone between $23 and $29 from the company’s first year of public trading, which lasted from 2020 to 2021.
Besides $21.85 offering support, the $20.24 high from August 1, 2023 might also be considered. The stock is trading well above its 20-day and 50-day Simple Moving Averages (SMAs), and it may trade with increased volatility until those SMAs close in on current price action.
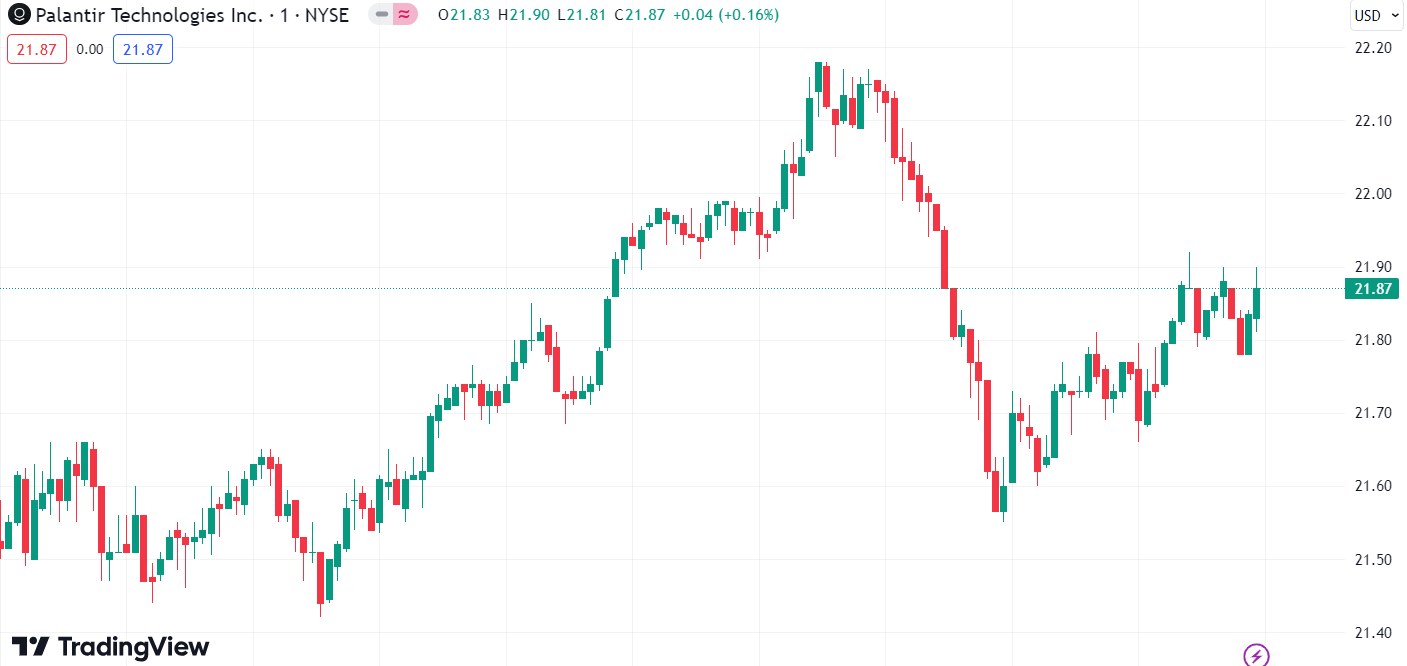
PLTR daily stock chart
Author

Clay Webster
FXStreet
Clay Webster grew up in the US outside Buffalo, New York and Lancaster, Pennsylvania. He began investing after college following the 2008 financial crisis.


