Oil rebounds with Libya headlines emerging on major field shutting down in full
- Oil prices are moving away from session's low in the US session.
- Libya's biggest oil field halts production.
- The US Dollar Index trades sharply lower and enters a correction phase.

Oil prices are recovering from an earlier 3% loss on Monday, with US markets seeing a bit of a recovery from intraday low levels. The Japanese stock market performance was a sign on the wall with its worst performance since 1987, with the Nikkei index sliding over 12% lower. Markets are scared that demand will start to shrink from here after a trifecta of very disappointing US data last week lit the fuse around recession fears, ignoring the bullish geopolitical elements and even Libya shutting down its major oil field.
Meanwhile, the US Dollar Index (DXY), which tracks the performance of the US Dollar against six major currencies, is receiving one gut punch after another. In normal risk-off movements, the Greenback is considered to be the safe haven. Though, as it is the same US data that is sparking that risk-off, it does not make sense as an investor to hold on to that cash anymore and park their investments in safe bonds, with the outlook that those high yields are soon to come to an end after US Federal Reserve Chairman Jerome Powell opened the door for an interest rate cut in September. The question for this week is if markets are over-exaggerating, and this is an ideal buy-the-dip moment on all fronts.
At the time of writing, Crude Oil (WTI) trades at $72.11 and Brent Crude at $75.83
Oil news and market movers: Libya halts production
- Although Oil prices are selling off, Saudi Arabia is convinced that Asia will continue with growth and demand, and hikes its prices for that region for the first time in three months, Bloomberg reports.
- Libya has started cutting production at its Sharara operation by at least 50,000 barrels per day to only 210,000, Reuters reports. As the day evolves, headlines emerge that the oil field has even halted production, which have been confirmed by Bloomberg.
- Vortexa data shows that the amount of Oil afloat in tankers has fallen 31% from last week, which could point to a recent pickup in demand.
- Overall, commodities are following suit with the global selloff, though losses look rather limited in the commodity space against the bigger losses in equities.
- Bloomberg futures data reveals that several hedge funded have shedded quite large portions of positions in Petroleum, which could mean a bear market is nearby, with the stock market reversion being the final domino to fall.
Oil Technical Analysis: More halts and cuts to come
Oil price is painting deep red candles since last week and seems to continue that sentiment again on Monday. However, it does pay off to take a step back and look at the broader picture, where there are still many moving parts on the geopolitical front that could easily reverse the current decline in Oil price. Hence, it does pay off to approach these moves with a pinch of salt, certainly seeing the summer holidays and a lot of desks being understaffed as per normal period in the year, and adds to the nervousness of seeing less volume is present to soothe market reactions.
On the upside, there is a chunky recovery to be had, though that could come swiftly. With the Relative Strength Index (RSI) being oversold, the first level to rebound to is the July 30 low at $74.24. Once back above there, $75.27 comes into play as the next pivotal level before heading back to the 200-day Simple Moving Average (SMA) at $78.03.
On the downside, expect this week’s moves to be on their last legs, as the RSI is nearing the end of the line. Look maybe for a test around $70.00 as a big psychological figure. A lot of buyers will be awaiting below that level to pick up some discount prices. The line in the sand is the blue line on the chart at $67.18, with that triple bottom formation from June 2023 as a hard support on the downside.
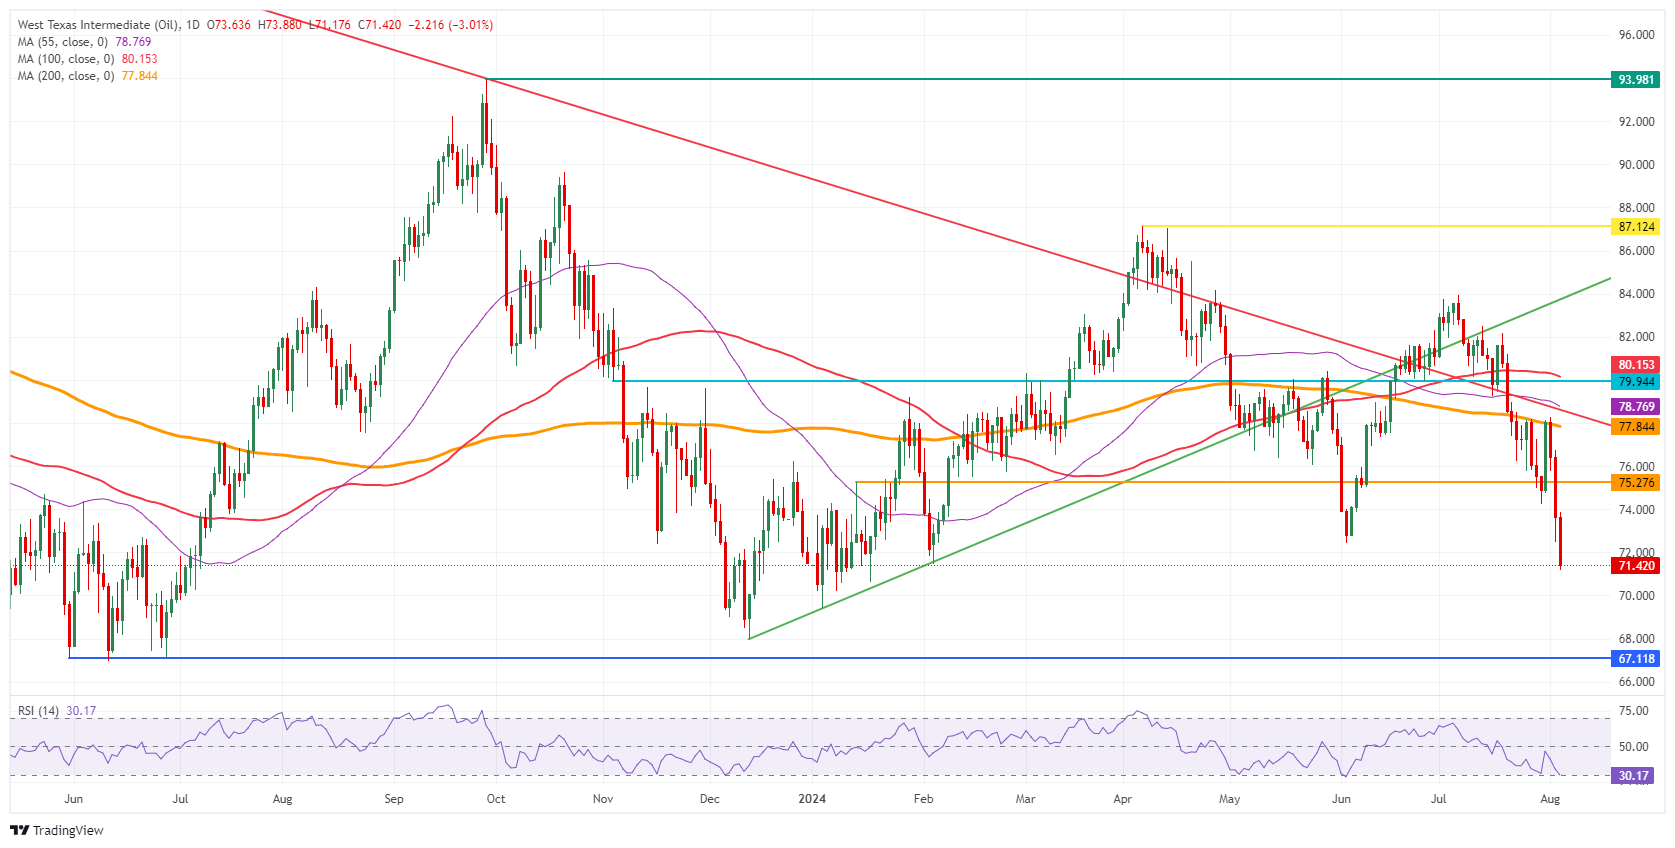
US WTI Crude Oil: Daily Chart
WTI Oil FAQs
WTI Oil is a type of Crude Oil sold on international markets. The WTI stands for West Texas Intermediate, one of three major types including Brent and Dubai Crude. WTI is also referred to as “light” and “sweet” because of its relatively low gravity and sulfur content respectively. It is considered a high quality Oil that is easily refined. It is sourced in the United States and distributed via the Cushing hub, which is considered “The Pipeline Crossroads of the World”. It is a benchmark for the Oil market and WTI price is frequently quoted in the media.
Like all assets, supply and demand are the key drivers of WTI Oil price. As such, global growth can be a driver of increased demand and vice versa for weak global growth. Political instability, wars, and sanctions can disrupt supply and impact prices. The decisions of OPEC, a group of major Oil-producing countries, is another key driver of price. The value of the US Dollar influences the price of WTI Crude Oil, since Oil is predominantly traded in US Dollars, thus a weaker US Dollar can make Oil more affordable and vice versa.
The weekly Oil inventory reports published by the American Petroleum Institute (API) and the Energy Information Agency (EIA) impact the price of WTI Oil. Changes in inventories reflect fluctuating supply and demand. If the data shows a drop in inventories it can indicate increased demand, pushing up Oil price. Higher inventories can reflect increased supply, pushing down prices. API’s report is published every Tuesday and EIA’s the day after. Their results are usually similar, falling within 1% of each other 75% of the time. The EIA data is considered more reliable, since it is a government agency.
OPEC (Organization of the Petroleum Exporting Countries) is a group of 13 Oil-producing nations who collectively decide production quotas for member countries at twice-yearly meetings. Their decisions often impact WTI Oil prices. When OPEC decides to lower quotas, it can tighten supply, pushing up Oil prices. When OPEC increases production, it has the opposite effect. OPEC+ refers to an expanded group that includes ten extra non-OPEC members, the most notable of which is Russia.
Author

Filip Lagaart
FXStreet
Filip Lagaart is a former sales/trader with over 15 years of financial markets expertise under its belt.


