NZD/USD technical analysis: Near-term upside capped by 0.6405/06 resistance-confluence
- NZD/USD slips below 23.6% Fibonacci retracement of its downpour since August 13.
- 200-HMA, 50% of Fibonacci retracement limits immediate upside.

Failure to hold recent recovery drags the NZD/USD pair to sub-23.6% Fibonacci retracement level while taking rounds to 0.6370, ahead of Tuesday’s European session opening.
The pair now aims to visit 0.6350 and Monday’s low near 0.6341. However, a downward sloping trend-line connecting Thursday’s low to latest bottom offers a rest around 0.6320.
Meanwhile, 0.6380 can act as immediate resistance during the pair’s pullback ahead of highlighting 0.6405/06 confluence including 200-hour moving average (HMA) and 50% Fibonacci retracement.
In a case where prices keep rallying beyond 0.6406, last week’s high near 0.6430 can lure buyers.
NZD/USD hourly chart
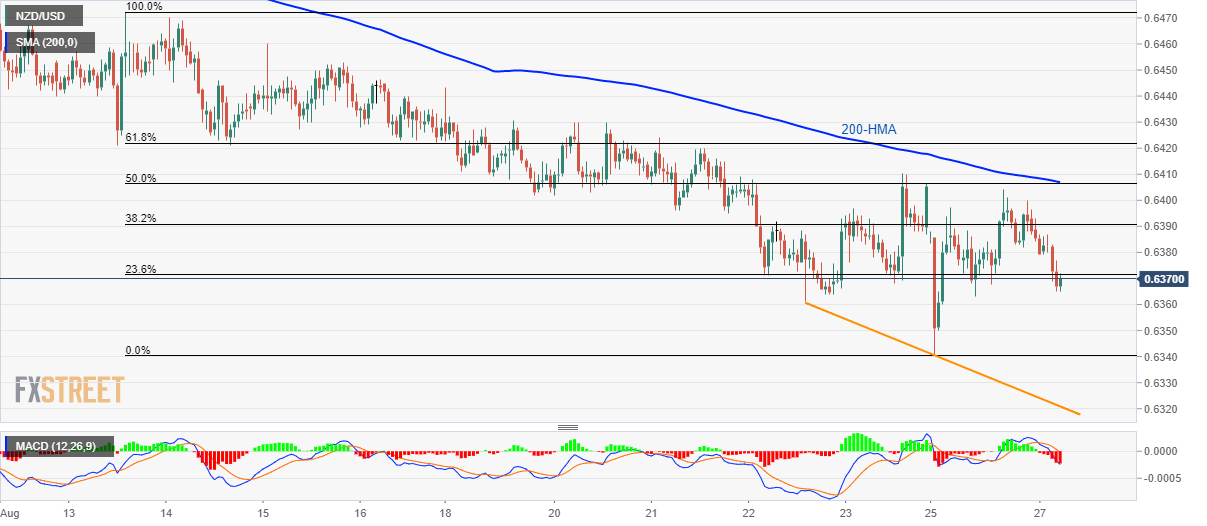
Trend: Bearish
Author

Anil Panchal
FXStreet
Anil Panchal has nearly 15 years of experience in tracking financial markets. With a keen interest in macroeconomics, Anil aptly tracks global news/updates and stays well-informed about the global financial moves and their implications.


