|

NZD/USD technical analysis: Buyers step back from 0.6475/76 confluence after China data

  • China’s July month activity data disappoint Kiwi buyers.
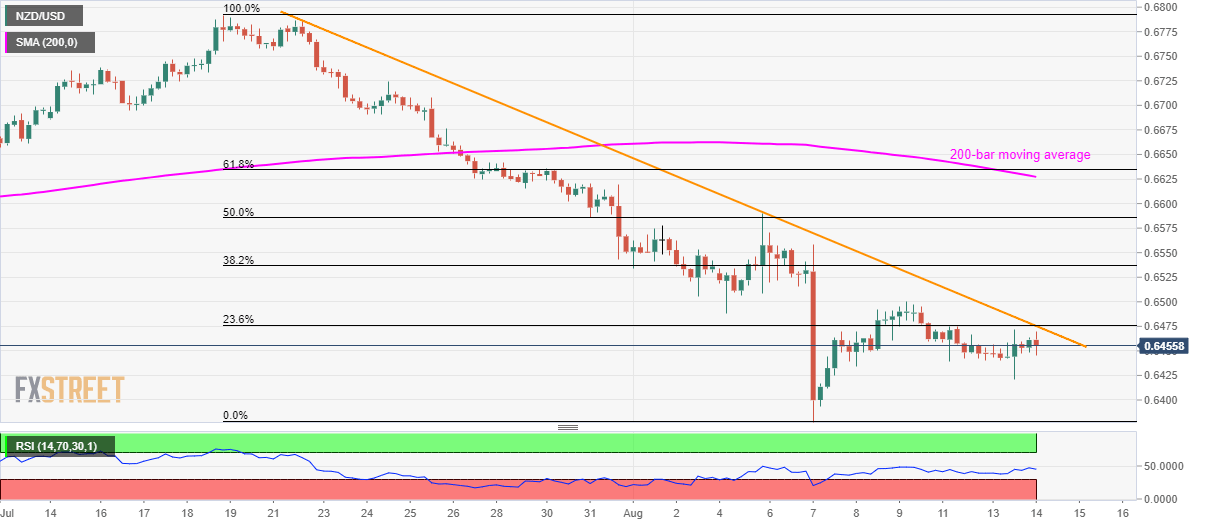
  • The NZD/USD pair takes a U-turn from 23.6% Fibonacci retracement and three-week-old resistance-line.

With China’s Industrial Production and Retail Sales lagging behind market consensus, NZD/USD witnesses pullback form near-term key resistance confluence as it trades near 0.6456 on early Wednesday.

China’s July month Industrial Production came in at 4.8% versus 5.8% expected while Retail Sales growth weakened to 7.6% against 8.6% forecast.

The pair now aims to revisit 0.6400 round-figure with 0.6425 being an intermediate halt. However, pair’s further declines will be limited to the monthly low of 0.6377, if not then 0.6350/45, including 2016 low, could grab sellers’ attention.

On the upside, a sustained break of 0.6475/76 enables the pair to aim for 0.6500 and monthly top surrounding 0.6590.

In a case buyers manage to dominate past-06590, 200-bar moving average at 0.6627 will be on their radar.

NZD/USD 4-hour chart

Trend: Bearish

    1. R3 0.6527 
    2. R2 0.6499 
    3. R1 0.6476 
  1. PP 0.6448 
    1. S1 0.6425
    2. S2  0.6397
    3. S3  0.6374

Author

Anil Panchal

Anil Panchal

FXStreet

Anil Panchal has nearly 15 years of experience in tracking financial markets. With a keen interest in macroeconomics, Anil aptly tracks global news/updates and stays well-informed about the global financial moves and their implications.

More from Anil Panchal
Share:

Editor's Picks

EUR/USD treads water above 1.1850 amid thin trading

EUR/USD stays defensive but holds 1.1850 amid quiet markets in the European hours on Monday.  The US Dollar is struggling for direction due to thin liquidity conditions as US markets are closed in observance of Presidents' Day. 

GBP/USD flat lines as traders await key UK and US macro data

GBP/USD kicks off a new week on a subdued note and oscillates in a narrow range near 1.365 in Monday's European trading. The mixed fundamental backdrop warrants some caution for aggressive traders as the market focus now shifts to this week's important releases from the UK and the US.

Gold sticks to intraday losses; lacks follow-through

Gold remains depressed through the early European session on Monday, though it has managed to rebound from the daily trough and currently trades around the $5,000 psychological mark. Moreover, a combination of supporting factors warrants some caution for aggressive bearish traders, and before positioning for deeper losses.

Bitcoin, Ethereum and Ripple consolidate within key ranges as selling pressure eases

Bitcoin and Ethereum prices have been trading sideways within key ranges following the massive correction. Meanwhile, XRP recovers slightly, breaking above the key resistance zone. The top three cryptocurrencies hint at a potential short-term recovery, with momentum indicators showing fading bearish signs.

Global inflation watch: Signs of cooling services inflation

Realized inflation landed close to expectations in January, as negative base effects weighed on the annual rates. Remaining sticky inflation is largely explained by services, while tariff-driven goods inflation remains limited even in the US.

Ripple Price Forecast: XRP potential bottom could be in sight

Ripple edges up above the intraday low of $1.35 at the time of writing on Friday amid mixed price actions across the crypto market. The remittance token failed to hold support at $1.40 the previous day, reflecting risk-off sentiment amid a decline in retail and institutional sentiment.