NZD/USD Price Forecast: Tests descending channel’s upper boundary above 0.5950
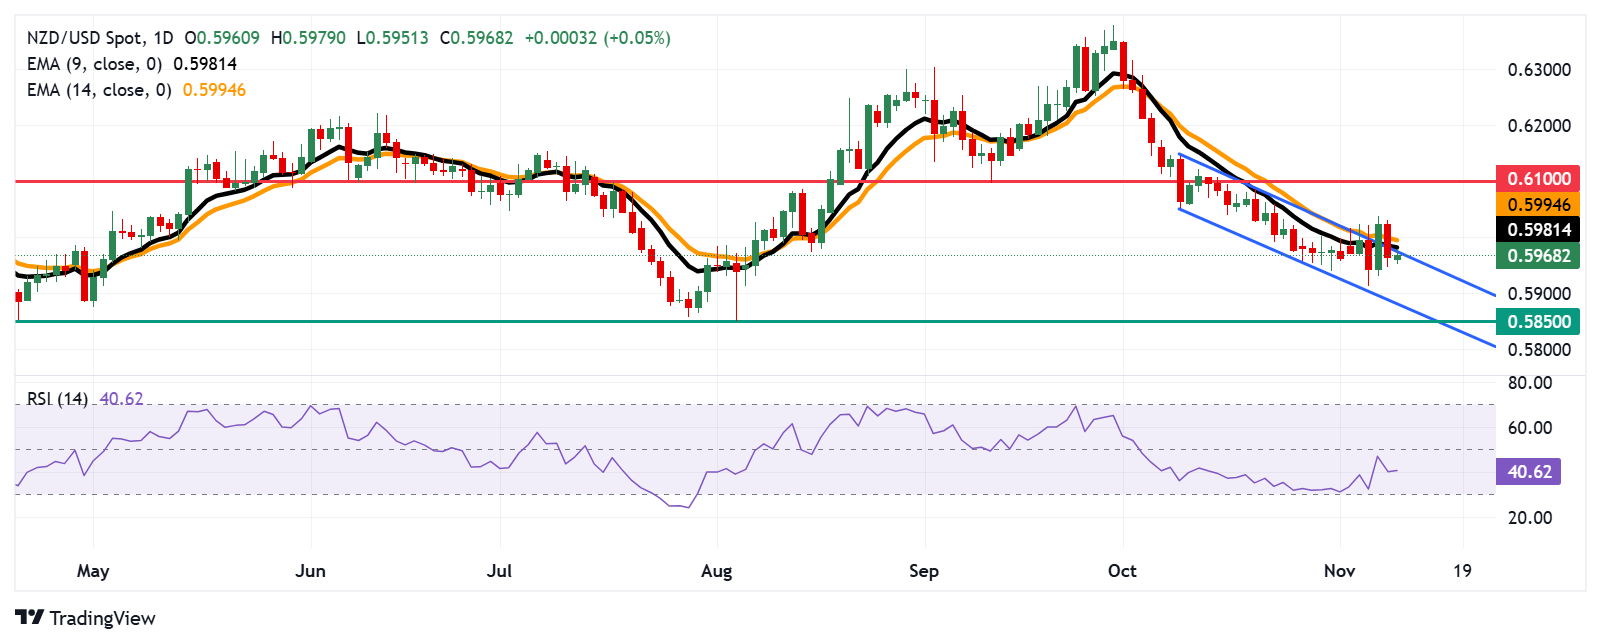
- NZD/USD tests the upper boundary of the descending channel near the nine-day EMA at 0.5980 level.
- The 14-day RSI remains below the 50 level; a further decline toward the 30 mark would strengthen bearish bias.
- The pair may depreciate toward the lower boundary of the descending channel at 0.5880 level.

The NZD/USD pair remains subdued for the second consecutive day, trading around 0.5960 during European hours on Monday. Analysis of the daily chart highlights a strong bearish bias, as the pair remains within a descending channel pattern.
The 14-day Relative Strength Index (RSI), a key momentum indicator, stays below the 50 level, indicating sustained bearish momentum. A further dip toward the 30 level would intensify this downward trend for the NZD/USD pair.
Additionally, the nine-day Exponential Moving Average (EMA) remains below the 14-day EMA, signaling continued weakness in short-term price momentum for the NZD/USD pair.
On the downside, NZD/USD may navigate the region around the psychological level of 0.5900, followed by the lower boundary of the descending channel at 0.5880 level. A break below the descending channel could strengthen the bearish bias and lead the pair to revisit the throwback support at the 0.5850 level.
Regarding the resistance, the NZD/USD pair finds an immediate barrier at the upper boundary of the descending channel at the nine-day EMA at 0.5980 level, followed by the 14-day EMA at 0.5994 level.
A break above the 14-day EMA would improve the price momentum and support the NZD/USD pair to explore the area around the psychological level of 0.6100 level.
NZD/USD: Daily Chart
New Zealand Dollar PRICE Today
The table below shows the percentage change of New Zealand Dollar (NZD) against listed major currencies today. New Zealand Dollar was the weakest against the US Dollar.
| USD | EUR | GBP | JPY | CAD | AUD | NZD | CHF | |
|---|---|---|---|---|---|---|---|---|
| USD | 0.30% | 0.17% | 0.72% | 0.20% | 0.00% | -0.08% | 0.32% | |
| EUR | -0.30% | -0.16% | 0.53% | 0.00% | -0.20% | -0.28% | 0.10% | |
| GBP | -0.17% | 0.16% | 0.60% | 0.17% | -0.04% | -0.12% | 0.26% | |
| JPY | -0.72% | -0.53% | -0.60% | -0.52% | -0.80% | -0.70% | -0.40% | |
| CAD | -0.20% | -0.01% | -0.17% | 0.52% | -0.14% | -0.29% | 0.09% | |
| AUD | -0.01% | 0.20% | 0.04% | 0.80% | 0.14% | -0.11% | 0.29% | |
| NZD | 0.08% | 0.28% | 0.12% | 0.70% | 0.29% | 0.11% | 0.38% | |
| CHF | -0.32% | -0.10% | -0.26% | 0.40% | -0.09% | -0.29% | -0.38% |
The heat map shows percentage changes of major currencies against each other. The base currency is picked from the left column, while the quote currency is picked from the top row. For example, if you pick the New Zealand Dollar from the left column and move along the horizontal line to the US Dollar, the percentage change displayed in the box will represent NZD (base)/USD (quote).
Author

Akhtar Faruqui
FXStreet
Akhtar Faruqui is a Forex Analyst based in New Delhi, India. With a keen eye for market trends and a passion for dissecting complex financial dynamics, he is dedicated to delivering accurate and insightful Forex news and analysis.


