NZD/USD Price Forecast: Breaks above descending channel pattern near 14-day EMA at 0.6000
- NZD/USD tests the 14-day Exponential Moving Average at the 0.6000 level.
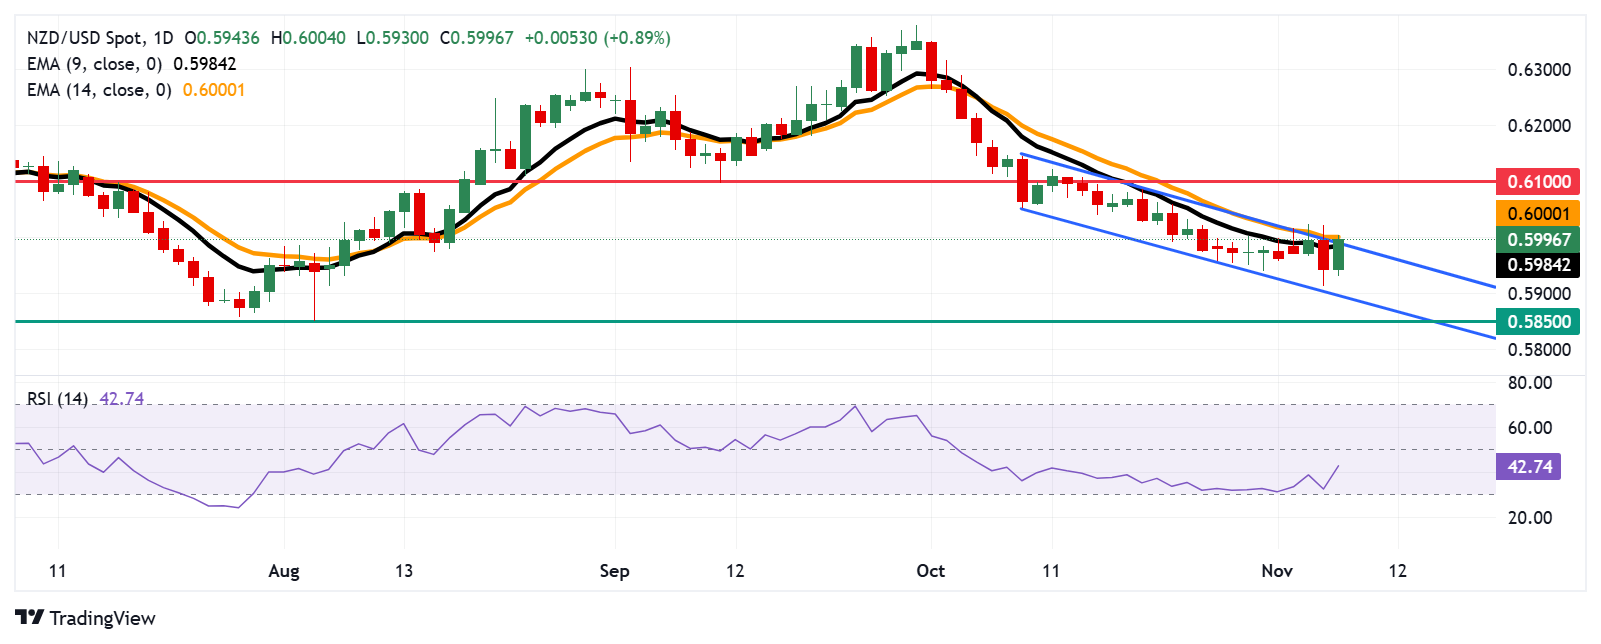
- The 14-day RSI remains below the 50 level, indicating an ongoing bearish bias for the pair.
- The immediate support appears at the upper boundary of the descending channel, aligned with the nine-day EMA at 0.5984 level.

The NZD/USD pair has recovered its recent losses from the previous session, trading around 0.5990 during the European hours on Thursday. Daily chart analysis indicates a weakening bearish bias, with the pair breaking above the nine-day Exponential Moving Average (EMA), aligned with the upper boundary of the descending channel.
However, the 14-day Relative Strength Index (RSI), a key momentum indicator, remains below the 50 level, suggesting a prevailing bearish trend. A further approach toward the 50 mark would improve the momentum of the NZD/USD pair.
Adding to this outlook, the nine-day Exponential Moving Average remains below the 14-day EMA, suggesting weakness in the short-term price momentum for the NZD/USD pair.
Regarding the resistance, the NZD/USD pair is testing the 14-day EMA at 0.6000 level. A break above this level would improve the price momentum and support the pair to explore the area around the psychological level of 0.6100 level.
On the downside, NZD/USD may find immediate support at the upper boundary of the descending channel, in case of re-entering the channel, aligned with the nine-day EMA at 0.5984 level.
A return into the channel would reinforce the bearish bias and put downward pressure on the NZD/USD pair to navigate the region around the lower boundary of the descending channel near a psychological level of 0.5900.
A break below the descending channel could strengthen the bearish bias and lead the NZD/USD pair to revisit the throwback support at the 0.5850 level.
NZD/USD: Daily Chart
(This story was corrected on November 7 at 14:36 GMT to say, in the first paragraph, that the nine-day EMA aligns with the upper boundary of the descending channel, not the lower boundary.)
New Zealand Dollar PRICE Today
The table below shows the percentage change of New Zealand Dollar (NZD) against listed major currencies today. New Zealand Dollar was the strongest against the Swiss Franc.
| USD | EUR | GBP | JPY | CAD | AUD | NZD | CHF | |
|---|---|---|---|---|---|---|---|---|
| USD | -0.21% | -0.21% | -0.31% | -0.41% | -0.93% | -0.86% | 0.02% | |
| EUR | 0.21% | 0.00% | -0.08% | -0.20% | -0.72% | -0.65% | 0.24% | |
| GBP | 0.21% | -0.01% | -0.08% | -0.20% | -0.73% | -0.66% | 0.24% | |
| JPY | 0.31% | 0.08% | 0.08% | -0.13% | -0.64% | -0.61% | 0.33% | |
| CAD | 0.41% | 0.20% | 0.20% | 0.13% | -0.51% | -0.44% | 0.45% | |
| AUD | 0.93% | 0.72% | 0.73% | 0.64% | 0.51% | 0.06% | 0.97% | |
| NZD | 0.86% | 0.65% | 0.66% | 0.61% | 0.44% | -0.06% | 0.91% | |
| CHF | -0.02% | -0.24% | -0.24% | -0.33% | -0.45% | -0.97% | -0.91% |
The heat map shows percentage changes of major currencies against each other. The base currency is picked from the left column, while the quote currency is picked from the top row. For example, if you pick the New Zealand Dollar from the left column and move along the horizontal line to the US Dollar, the percentage change displayed in the box will represent NZD (base)/USD (quote).
Author

Akhtar Faruqui
FXStreet
Akhtar Faruqui is a Forex Analyst based in New Delhi, India. With a keen eye for market trends and a passion for dissecting complex financial dynamics, he is dedicated to delivering accurate and insightful Forex news and analysis.


