- NZD/USD struggles to defend the first positive daily gains in four.
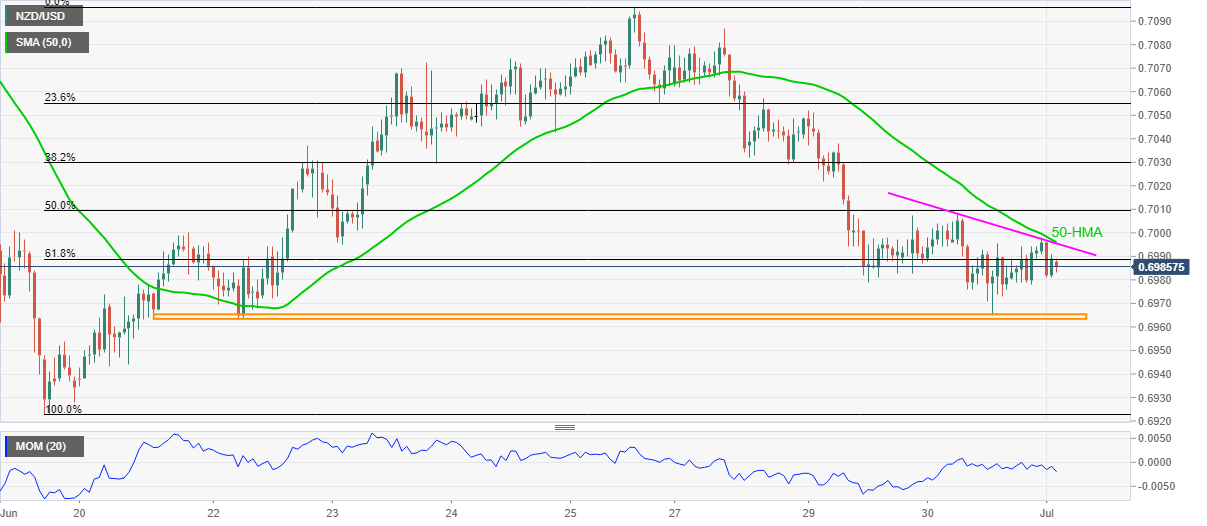
- Two-day-old falling trend line, 50-HMA guards immediate upside, multiple support from June 21 test sellers.
- Momentum line suggests further grinding to the south, bulls may hesitate for entry below 0.7030.
NZD/USD wobbles around 0.6990, up 0.10% intraday, during the first positive day of the week. Even so, the Kiwi pair remains clubbed inside a 40-pips trading region amid a downward sloping Momentum line.
On the fundamental side, downbeat data from China and Australia join the latest covid woes in the Asia-Pacific to weigh on the quote.
Read: AUD/USD stays on the way to yearly low below 0.7500 on mixed Aussie, China data
Hence, the NZD/USD sellers may keep reins but will wait for a clear downside break of 0.6960 for fresh entries targeting the yearly low of 0.6923.
In a case where the bears dominate past 0.69123, the 0.6900 threshold and September 2020 top near 0.6800 will be in the spotlight.
On the other hand, an upside clearance of the 0.7000 round-figure, comprising 50-HMA and immediate falling trend line, could escalate the recovery moves to the 38.2% Fibonacci retracement of June 18-25 upside, near 0.7030.
However, any further upside will enable the NZD/USD buyers to aim for the late June tops surrounding 0.7100 before confronting multiple lows marked between April and June around 0.7125.
To sum up, NZD/USD remains on the back foot despite the latest bounce and hence further losses can’t be ruled out.
NZD/USD hourly chart
Trend: Further weakness expected
Information on these pages contains forward-looking statements that involve risks and uncertainties. Markets and instruments profiled on this page are for informational purposes only and should not in any way come across as a recommendation to buy or sell in these assets. You should do your own thorough research before making any investment decisions. FXStreet does not in any way guarantee that this information is free from mistakes, errors, or material misstatements. It also does not guarantee that this information is of a timely nature. Investing in Open Markets involves a great deal of risk, including the loss of all or a portion of your investment, as well as emotional distress. All risks, losses and costs associated with investing, including total loss of principal, are your responsibility. The views and opinions expressed in this article are those of the authors and do not necessarily reflect the official policy or position of FXStreet nor its advertisers. The author will not be held responsible for information that is found at the end of links posted on this page.
If not otherwise explicitly mentioned in the body of the article, at the time of writing, the author has no position in any stock mentioned in this article and no business relationship with any company mentioned. The author has not received compensation for writing this article, other than from FXStreet.
FXStreet and the author do not provide personalized recommendations. The author makes no representations as to the accuracy, completeness, or suitability of this information. FXStreet and the author will not be liable for any errors, omissions or any losses, injuries or damages arising from this information and its display or use. Errors and omissions excepted.
The author and FXStreet are not registered investment advisors and nothing in this article is intended to be investment advice.
Recommended content
Editors’ Picks
EUR/USD clings to gains above 1.0750 after US data

EUR/USD manages to hold in positive territory above 1.0750 despite retreating from the fresh multi-week high it set above 1.0800 earlier in the day. The US Dollar struggles to find demand following the weaker-than-expected NFP data.
GBP/USD declines below 1.2550 following NFP-inspired upsurge

GBP/USD struggles to preserve its bullish momentum and trades below 1.2550 in the American session. Earlier in the day, the disappointing April jobs report from the US triggered a USD selloff and allowed the pair to reach multi-week highs above 1.2600.
Gold struggles to hold above $2,300 despite falling US yields

Gold stays on the back foot below $2,300 in the American session on Friday. The benchmark 10-year US Treasury bond yield stays in negative territory below 4.6% after weak US data but the improving risk mood doesn't allow XAU/USD to gain traction.
Bitcoin Weekly Forecast: Should you buy BTC here? Premium

Bitcoin (BTC) price shows signs of a potential reversal but lacks confirmation, which has divided the investor community into two – those who are buying the dips and those who are expecting a further correction.
Week ahead – BoE and RBA decisions headline a calm week

Bank of England meets on Thursday, unlikely to signal rate cuts. Reserve Bank of Australia could maintain a higher-for-longer stance. Elsewhere, Bank of Japan releases summary of opinions.