|

NZD/USD Price Analysis: Justifies Friday’s bearish Doji below 0.6350

  • NZD/USD prints mild losses around a two-week high, justifies the previous day’s bearish candlestick formation.
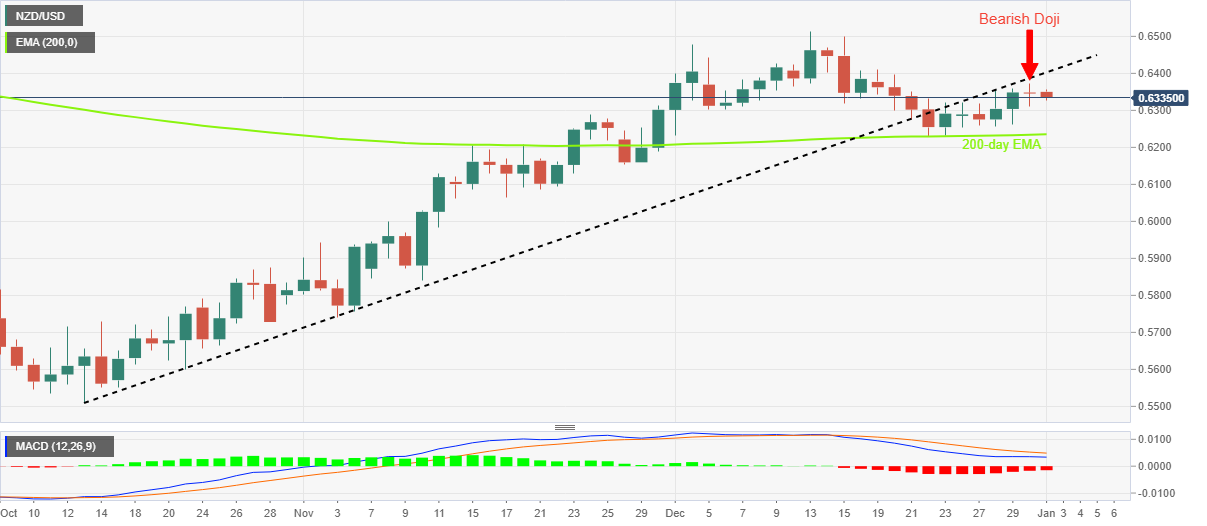
  • Previous support line from October, bearish MACD signals also keeps sellers hopeful.
  • 200-day EMA holds the key to Kiwi bear’s conviction.

NZD/USD holds lower ground near the intraday bottom of 0.6329 during the mid-Asian session on a sluggish Monday. The Kiwi pair’s latest inaction could be linked to the holidays in multiple markets, including New Zealand.

Even so, the quote prints mild losses while justifying the previous day’s bearish Doji candlestick. Also favoring the NZD/USD bears are the bearish MACD signals and the pair’s sustained trading below the previous support line from October 13, now resistance around 0.6400.

As a result, the Kiwi pair is likely to extend the latest weakness toward the 200-day Exponential Moving Average (EMA) support surrounding 0.6235.

During the fall, the 0.6300 round figure may act as an intermediate halt whereas the late November swing low around 0.6155 could challenge the NZD/USD bears afterward.

On the contrary, the Kiwi pair’s successful trading above 0.6400 support-turned-resistance could propel the quote toward the previous monthly high near 0.6515.

It’s worth noting that the NZD/USD pair’s sustained run-up beyond 0.6515 enables the bulls to aim for a June 2022 high of 0.6575.

Overall, NZD/USD is likely to extend the latest pullback but the downside room appears limited.

NZD/USD: Daily chart

Trend: Limited downside expected

Additional important levels

Overview
Today last price0.634
Today Daily Change-0.0008
Today Daily Change %-0.13%
Today daily open0.6348
 
Trends
Daily SMA200.6346
Daily SMA500.616
Daily SMA1000.604
Daily SMA2000.6241
 
Levels
Previous Daily High0.6373
Previous Daily Low0.631
Previous Weekly High0.6373
Previous Weekly Low0.6253
Previous Monthly High0.6514
Previous Monthly Low0.623
Daily Fibonacci 38.2%0.6334
Daily Fibonacci 61.8%0.6349
Daily Pivot Point S10.6315
Daily Pivot Point S20.6281
Daily Pivot Point S30.6252
Daily Pivot Point R10.6377
Daily Pivot Point R20.6406
Daily Pivot Point R30.644

Author

Anil Panchal

Anil Panchal

FXStreet

Anil Panchal has nearly 15 years of experience in tracking financial markets. With a keen interest in macroeconomics, Anil aptly tracks global news/updates and stays well-informed about the global financial moves and their implications.

More from Anil Panchal
Share:

Editor's Picks

EUR/USD faces some resistance near 100-SMA on H4, around 1.1830 zone

The EUR/USD pair gains some follow-through positive traction for the second consecutive day and climbs to the 1.1830 region during the Asian session on Thursday. The US Dollar remains on the back foot amid concerns about the economic fallout from US President Donald Trump's erratic trade policies and acts as a tailwind for spot prices.

GBP/USD extends recovery to near 20-day EMA as US Dollar weakens

The Pound Sterling holds onto weekly gains around 1.3565 against the US Dollar during the Asian trading session on Thursday. The GBP/USD pair trades firmly as the US Dollar remains under pressure due to uncertainty surrounding the United States trade policy outlook.

Gold struggle with $5,200 extends ahead of more US-Iran talks

Gold is replicating the recovery moves seen in Wednesday’s Asian trading early Thursday, as buyers continue to flirt with the $5,200 level. Sustained US Dollar weakness and looming US-Iran talks aid the bright metal’s rebound.  

Top Crypto Gainers: Polkadot, Near Protocol, Uniswap lead market rebound

Altcoins, such as Polkadot, Near Protocol, and Uniswap, are leading gains over the last 24 hours as Bitcoin jumped 6% on Wednesday. The altcoins are holding steady at press time on Thursday following a rebound the previous day, testing the waters around their 50-day Exponential Moving Average. 

Nvidia delivers another monster earnings report, and forecasts big things to come

It was another monster earnings report from Nvidia for fiscal Q4. Revenues were $68.1bn, smashing estimates of $65bn. Gross profit margin was a healthy 75%, up from 73.5% in the prior quarter, and the outlook for this quarter was monstrous.

Cosmos Hub Price Forecast: ATOM rebounds slightly, bearish outlook remains intact

Cosmos Hub (ATOM) price rebounds, trading above $2.05 at the time of writing on Wednesday, after undergoing a sharp correction since last week. Weakening on-chain and derivatives data support a bearish outlook, while technical analysis remains unfavorable.