|

NZD/USD Price Analysis: Declines to 20-DEMA as US Dollar strengthens

  • NZD/USD slides further to 0.6130 as the Fed’s hawkish outlook dampens the market mood.
  • The Fed signaled one rate cut this year amid uncertainty over the inflation outlook.
  • NZD/USD fails to deliver an Inverted H&S breakout.

The NZD/USD pair tumbles to near 0.6130 in Friday’s European session. The Kiwi asset faces an intense sell-off as the US Dollar (USD) strengthens due to the Federal Reserve’s (Fed) hawkish interest rate outlook. The US Dollar Index (DXY), which tracks the Greenback’s value against six major currencies, jumps to 105.70, the highest level seen in a month.

The Fed advocated for only one rate cut this year against three projected in March as policymakers remain concerned over progress in disinflation due to strong labor market conditions. Fed’s hawkish narrative has also resulted in a dismal market mood. S&P 500 futures have posted significant losses in the London session, suggesting a sharp decline in investors’ risk appetite.

However, 10-year US Treasury yields fall further to 4.22% as market expectations for Fed rate cuts in September have been improved significantly due to soft United States consumer and producer inflation reports for May in which all components were lower than expectations.

Meanwhile, the New Zealand Dollar weakens after poor Business NZ Purchasing Managers’ Index (PMI) data for May, which showed that factory activity declined to 47.2 from the prior release of 48.8, downwardly revised from 48.9. A figure below the 50.0 threshold is itself considered as contraction.

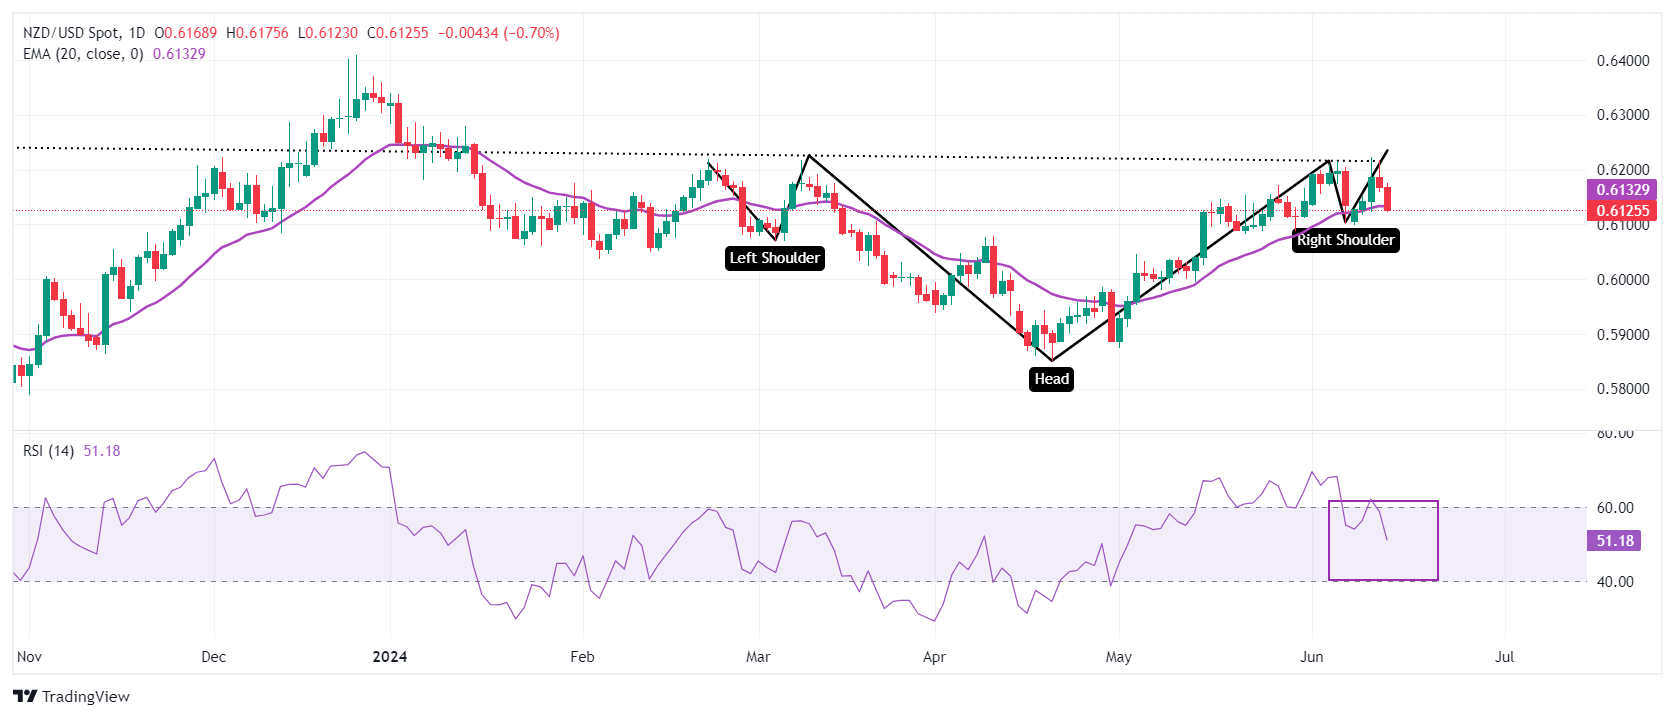
NZD/USD faces selling pressure above 0.6200 while attempting to deliver a breakout of the Inverted Head and Shoulder (H&S) chart pattern formed on a daily timeframe. The neckline of the above-mentioned chart pattern is marked near 0.6215. The asset has declined slightly below the 20-day Exponential Moving Average (EMA) near 0.6130. A decisive break below the same would weaken its near-term outlook.

The 14-period Relative Strength Index (RSI) falls back into the 40.00-60.00 range, indicating that the upside momentum has faded.

Fresh downside would appear if the asset breaks below April 4 high around 0.6050 This would drag the asset towards the psychological support of 0.6000 and April 25 high at 0.5969.

On the contrary, a reversal move above June 12 high of 0.6222, which will expose the asset January 15 high near 0.6250, followed by January 12 high near 0.6280.

NZD/USD daily chart

NZD/USD

Overview
Today last price0.6126
Today Daily Change-0.0043
Today Daily Change %-0.70
Today daily open0.6169
 
Trends
Daily SMA200.6141
Daily SMA500.6044
Daily SMA1000.6069
Daily SMA2000.6059
 
Levels
Previous Daily High0.6218
Previous Daily Low0.6159
Previous Weekly High0.6216
Previous Weekly Low0.6101
Previous Monthly High0.6171
Previous Monthly Low0.5875
Daily Fibonacci 38.2%0.6181
Daily Fibonacci 61.8%0.6195
Daily Pivot Point S10.6146
Daily Pivot Point S20.6123
Daily Pivot Point S30.6088
Daily Pivot Point R10.6205
Daily Pivot Point R20.624
Daily Pivot Point R30.6263

Author

Sagar Dua

Sagar Dua

FXStreet

Sagar Dua is associated with the financial markets from his college days. Along with pursuing post-graduation in Commerce in 2014, he started his markets training with chart analysis.

More from Sagar Dua
Share:

Markets move fast. We move first.

Orange Juice Newsletter brings you expert driven insights - not headlines. Every day on your inbox.

By subscribing you agree to our Terms and conditions.

Editor's Picks

EUR/USD moves sideways below 1.1800 on Christmas Eve

EUR/USD struggles to find direction and trades in a narrow channel below 1.1800 after posting gains for two consecutive days. Bond and stock markets in the US will open at the usual time and close early on Christmas Eve, allowing the trading action to remain subdued. 

GBP/USD keeps range around 1.3500 amid quiet markets

GBP/USD keeps its range trade intact at around 1.3500 on Wednesday. The Pound Sterling holds the upper hand over the US Dollar amid pre-Christmas light trading as traders move to the sidelines heading into the holiday season. 

Gold retreats from record highs, trades below $4,500

Gold retreats after setting a new record-high above $4,520 earlier in the day and trades in a tight range below $4,500 as trading volumes thin out ahead of the Christmas break. The US Dollar selling bias remains unabated on the back of dovish Fed expectations, which continues to act as a tailwind for the bullion amid persistent geopolitical risks.

Bitcoin slips below $87,000 as ETF outflows intensify, whale participation declines

Bitcoin price continues to trade around $86,770 on Wednesday, after failing to break above the $90,000 resistance. US-listed spot ETFs record an outflow of $188.64 million on Tuesday, marking the fourth consecutive day of withdrawals.

Economic outlook 2026-2027 in advanced countries: Solidity test

After a year marked by global economic resilience and ending on a note of optimism, 2026 looks promising and could be a year of solid economic performance. In our baseline scenario, we expect most of the supportive factors at work in 2025 to continue to play a role in 2026.

Avalanche struggles near $12 as Grayscale files updated form for ETF

Avalanche trades close to $12 by press time on Wednesday, extending the nearly 2% drop from the previous day. Grayscale filed an updated form to convert its Avalanche-focused Trust into an ETF with the US Securities and Exchange Commission.