NZD/USD Price Analysis: Classic case of cup-and-handle highlights 0.6535 as the key hurdle


  • NZD/USD picks up bids to pare intraday losses inside bullish chart formation.
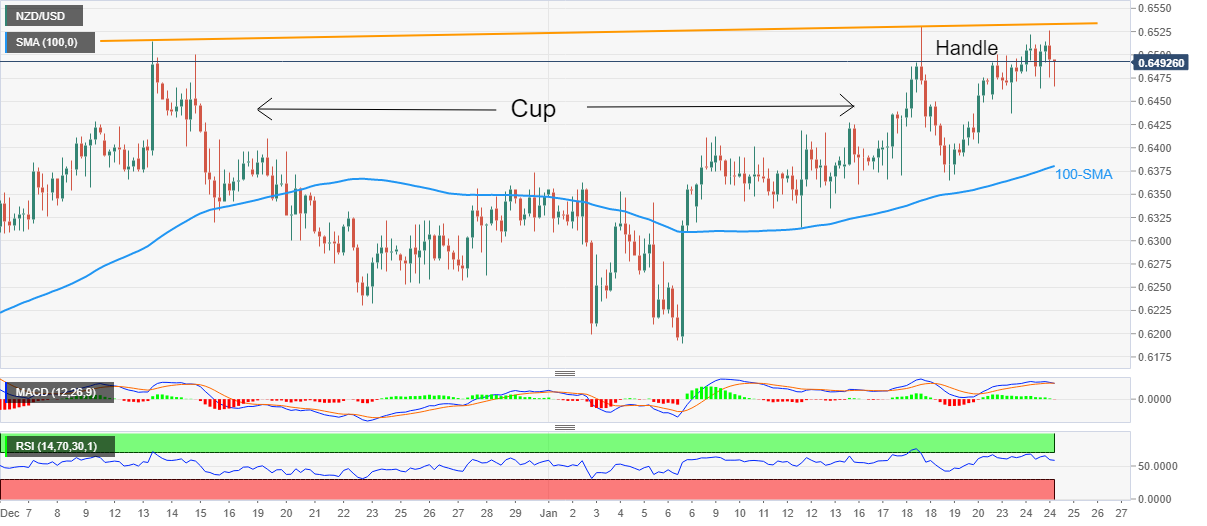
  • Looming bear cross on MACD, RSI retreat signal further pullback.
  • 100-SMA puts a floor under the Kiwi price, bulls can aim for previous yearly top on sustained break of 0.6535.

NZD/USD licks its wounds near 0.6490 as it pares the intraday loss, the first in four days, during the mid-Asian session on Wednesday. In doing so, the quote justifies the RSI (14) retreat from the overbought territory, as well as the impending bear cross on the MACD.

Even so, the upbeat New Zealand inflation data and a cup-and-handle bullish chart formation on the four-hour play keep the Kiwi pair buyers hopeful.

That said, the quote’s latest weakness remains elusive unless breaking the 100-SMA support of 0.6380.

In a case where the NZD/USD pair drops below 0.6380, the bullish chart formation gets rejection, which in turn can drag the quote toward the monthly low near 0.6190. It should be noted that the 0.6300 round figure may offer an intermediate halt during the fall.

Alternatively, bulls need to portray a successful break of the 0.6535 hurdle to confirm the cup-and-handle chart pattern to theoretically aim for the previous yearly top surrounding 0.7035.

During the anticipated run-up, the mid-2022 peak near 0.6575 may act as buffer while the RSI conditions may challenge the NZD/USD bulls on the way to 0.7035.

NZD/USD: Four-hour chart

Trend: Pullback expected

Additional important levels

Overview
Today last price 0.6488
Today Daily Change -0.0014
Today Daily Change % -0.22%
Today daily open 0.6502
 
Trends
Daily SMA20 0.6372
Daily SMA50 0.6325
Daily SMA100 0.6073
Daily SMA200 0.6198
 
Levels
Previous Daily High 0.6522
Previous Daily Low 0.6464
Previous Weekly High 0.6531
Previous Weekly Low 0.6361
Previous Monthly High 0.6514
Previous Monthly Low 0.623
Daily Fibonacci 38.2% 0.65
Daily Fibonacci 61.8% 0.6486
Daily Pivot Point S1 0.647
Daily Pivot Point S2 0.6437
Daily Pivot Point S3 0.6411
Daily Pivot Point R1 0.6528
Daily Pivot Point R2 0.6554
Daily Pivot Point R3 0.6587


Share: Feed news

Information on these pages contains forward-looking statements that involve risks and uncertainties. Markets and instruments profiled on this page are for informational purposes only and should not in any way come across as a recommendation to buy or sell in these assets. You should do your own thorough research before making any investment decisions. FXStreet does not in any way guarantee that this information is free from mistakes, errors, or material misstatements. It also does not guarantee that this information is of a timely nature. Investing in Open Markets involves a great deal of risk, including the loss of all or a portion of your investment, as well as emotional distress. All risks, losses and costs associated with investing, including total loss of principal, are your responsibility. The views and opinions expressed in this article are those of the authors and do not necessarily reflect the official policy or position of FXStreet nor its advertisers. The author will not be held responsible for information that is found at the end of links posted on this page.

If not otherwise explicitly mentioned in the body of the article, at the time of writing, the author has no position in any stock mentioned in this article and no business relationship with any company mentioned. The author has not received compensation for writing this article, other than from FXStreet.

FXStreet and the author do not provide personalized recommendations. The author makes no representations as to the accuracy, completeness, or suitability of this information. FXStreet and the author will not be liable for any errors, omissions or any losses, injuries or damages arising from this information and its display or use. Errors and omissions excepted.

The author and FXStreet are not registered investment advisors and nothing in this article is intended to be investment advice.

Recommended content


Recommended content

Editors’ Picks

EUR/USD stays in positive territory above 1.0850 after US data

EUR/USD stays in positive territory above 1.0850 after US data

EUR/USD clings to modest daily gains above 1.0850 in the second half of the day on Friday. The improving risk mood makes it difficult for the US Dollar to hold its ground after PCE inflation data, helping the pair edge higher ahead of the weekend.

EUR/USD News

GBP/USD stabilizes above 1.2850 as risk mood improves

GBP/USD stabilizes above 1.2850 as risk mood improves

GBP/USD maintains recovery momentum and fluctuates above 1.2850 in the American session on Friday. The positive shift seen in risk mood doesn't allow the US Dollar to preserve its strength and supports the pair.

GBP/USD News

Gold rebounds above $2,380 as US yields stretch lower

Gold rebounds above $2,380 as US yields stretch lower

Following a quiet European session, Gold gathers bullish momentum and trades decisively higher on the day above $2,380. The benchmark 10-year US Treasury bond yield loses more than 1% on the day after US PCE inflation data, fuelling XAU/USD's upside.

Gold News

Avalanche price sets for a rally following retest of key support level

Avalanche price sets for a rally following retest of  key support level

Avalanche (AVAX) price bounced off the $26.34 support level to trade at $27.95 as of Friday. Growing on-chain development activity indicates a potential bullish move in the coming days.

Read more

The election, Trump's Dollar policy, and the future of the Yen

The election, Trump's Dollar policy, and the future of the Yen

After an assassination attempt on former President Donald Trump and drop out of President Biden, Kamala Harris has been endorsed as the Democratic candidate to compete against Trump in the upcoming November US presidential election.

Read more

Forex MAJORS

Cryptocurrencies

Signatures