|

NZD/USD Price Analysis: Builds cushion near lower end of rising channel around 0.6200

  • NZD/USD is building a cushion near the lower end of the Rising Channel around 0.6200.
  • A responsive buying for the New Zealand Dollar is highly expected as the US Dollar has shown correction.
  • Fewer chances of continuation of ongoing increases by the Fed have heavily impacted US Treasury yields.

The NZD/USD pair is displaying a back-and-forth action in a narrow range of 0.6191-0.6212 continuously since Friday. The Kiwi asset has turned sideways and signs of recovery are solidifying as the US Dollar Index (DXY) has shown some correction.

The USD Index (DXY) has corrected to near 103.00 after failing to extend recovery above 103.36. S&P500 futures have generated solid gains in the morning session on hopes that more financial support to mid-size United States lenders from the Federal Reserve (Fed) would infuse confidence among investors and in households for making more deposits.

Fewer chances of continuation of ongoing increases in the interest rate by the Federal Reserve (Fed) after the banking fiasco have heavily impacted US Treasury yields. The return offered on 10-year US Treasury bonds has dropped sharply to near 3.37%. Contrary, economists at Goldman Sachs believe that the Fed will announce two more rate hikes in May and June by 25 basis points (bps).

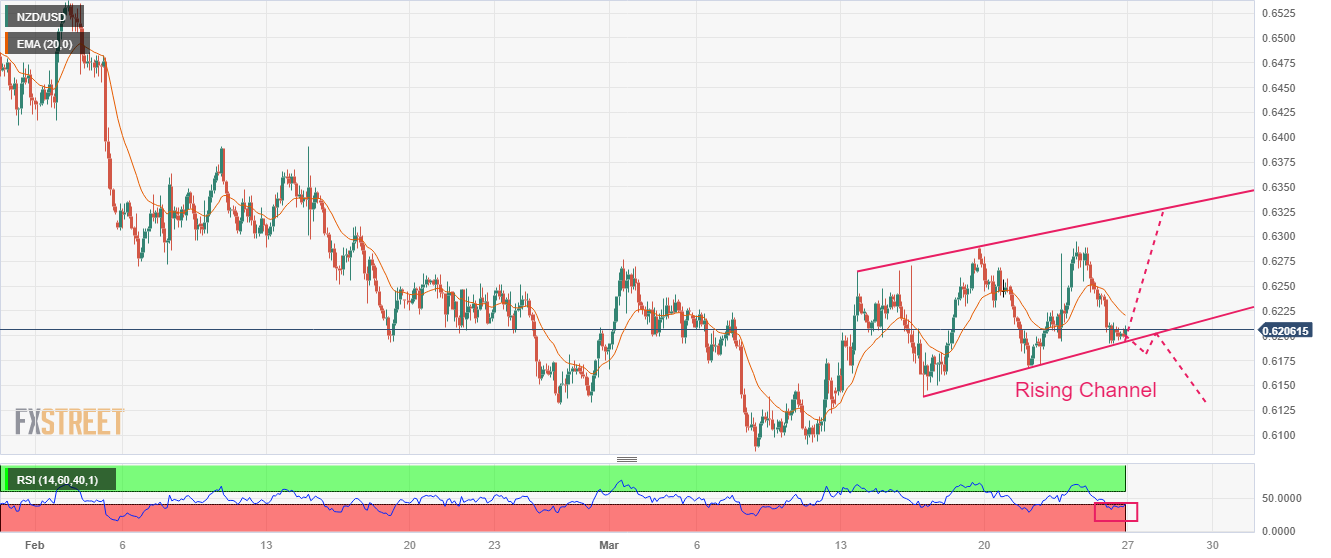
NZD/USD is demonstrating a small inventory adjustment near the lower edge of the Rising Channel chart pattern formed on a two-hour scale. In a Rising Channel chart pattern corrective moves are considered as buying opportunities by the market participants.

The Kiwi asset is auctioning below the 20-period Exponential Moving Average (EMA) at 0.6222, which indicates that the short-term bias is still on the downside.

Meanwhile, the Relative Strength Index (RSI) (14) has slipped into the bearish range of 20.00-40.00, which also favors a downside bias.

An extension of recovery above March 07 high at 0.6223 will drive the asset toward March 13 high at 0.6265 followed by the upper end of the chart pattern around 0.6325.

On the flip side, a breakdown of March 21 low at 0.6167 will drag the asset toward March 15 low at 0.6139. A slippage below the latter will expose the asset for more downside toward the round-level support at 0.6100.

NZD/USD two-hour chart

NZD/USD

Overview
Today last price0.6207
Today Daily Change0.0005
Today Daily Change %0.08
Today daily open0.6202
 
Trends
Daily SMA200.6196
Daily SMA500.6297
Daily SMA1000.6282
Daily SMA2000.6161
 
Levels
Previous Daily High0.6256
Previous Daily Low0.6192
Previous Weekly High0.6295
Previous Weekly Low0.6167
Previous Monthly High0.6538
Previous Monthly Low0.6131
Daily Fibonacci 38.2%0.6216
Daily Fibonacci 61.8%0.6232
Daily Pivot Point S10.6177
Daily Pivot Point S20.6153
Daily Pivot Point S30.6113
Daily Pivot Point R10.6241
Daily Pivot Point R20.6281
Daily Pivot Point R30.6305

Author

Sagar Dua

Sagar Dua

FXStreet

Sagar Dua is associated with the financial markets from his college days. Along with pursuing post-graduation in Commerce in 2014, he started his markets training with chart analysis.

More from Sagar Dua
Share:

Markets move fast. We move first.

Orange Juice Newsletter brings you expert driven insights - not headlines. Every day on your inbox.

By subscribing you agree to our Terms and conditions.

Editor's Picks

EUR/USD bounces toward 1.1750 as US Dollar loses strength

EUR/USD returned to the 1.1750 price zone in the American session on Friday, despite falling Wall Street, which indicates risk aversion. Trading conditions remain thin following the New Year holiday and ahead of the weekend, with the focus shifting to US employment and European data scheduled for next week.

GBP/USD nears 1.3500, holds within familiar levels

After testing 1.3400 on the last day of 2025, GBP/USD managed to stage a rebound. Nevertheless, the pair finds it difficult to gather momentum and trades with modest intraday gains at around 1.3490 as market participants remain in holiday mood.

Gold trims intraday gains, approaches $4,300

Gold retreated sharply from the $4,400  area and trades flat for the day in the $4,320 price zone. Choppy trading conditions exacerbated the intraday decline, although XAU/USD bearish case is out of the picture, considering growing expectations for a dovish Fed and persistent geopolitical tensions.

Cardano gains early New Year momentum, bulls target falling wedge breakout

Cardano kicks off the New Year on a positive note and is extending gains, trading above $0.36 at the time of writing on Friday. Improving on-chain and derivatives data point to growing bullish interest, while the technical outlook keeps an upside breakout in focus.

Economic outlook 2026-2027 in advanced countries: Solidity test

After a year marked by global economic resilience and ending on a note of optimism, 2026 looks promising and could be a year of solid economic performance. In our baseline scenario, we expect most of the supportive factors at work in 2025 to continue to play a role in 2026.

Crypto market outlook for 2026

Year 2025 was volatile, as crypto often is.  Among positive catalysts were favourable regulatory changes in the U.S., rise of Digital Asset Treasuries (DAT), adoption of AI and tokenization of Real-World-Assets (RWA).