NZD/USD Price Analysis: Bounces back strongly to 0.6100 as US Inflation cools in May
- NZD/USD rebounds strongly to 0.6100 on an expected decline in the US core PCE Inflation data for May.
- Annual US core PCE declined to 2.6% from 2.8% in April.
- Cooling US inflation figures have boosted Fed rate-cut prospects.

The NZD/USD pair recovers its intraday losses and rises to near the round-level resistance of 0.6100 in Friday’s American session. The Kiwi asset gains as the US Dollar (USD) declines after the United States (US) Personal Consumption Expenditure inflation (PCE) report showed that price pressures softened expectedly in May.
The PCE inflation report showed that inflation decelerated to 2.6% from the prior release of 2.8% on a year-on-year. On month, price pressures grew at a slower pace of 0.1% from the former release of 0.3%, upwardly revised from 0.2%. Soft US inflation data has prompted expectations of early rate cuts by the Federal Reserve (Fed).
The US Dollar Index (DXY), which tracks the Greenback’s value against six major currencies, drops to near 105.80.
Meanwhile, the New Zealand Dollar (NZD) will dance to the tunes of the Caixin Manufacturing PMI data for June, which will be published on Monday. Activities in the manufacturing sectors are expected to have grown modestly to 51.2 from the prior release of 51.7. It is worth noting that New Zealand is one of the leading trading partners of China and slower growth in China weighs on the New Zealand Dollar.
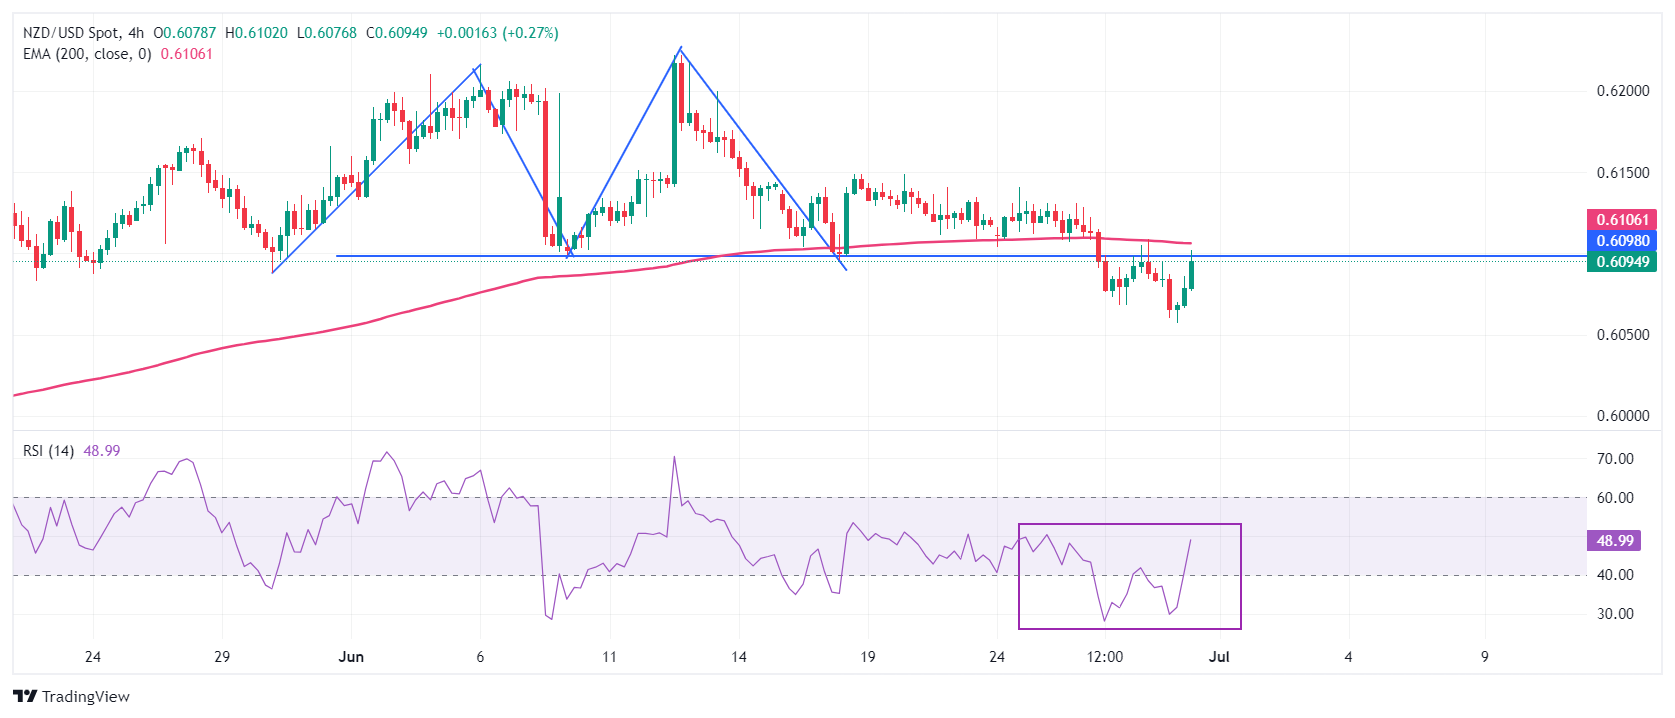
NZD/USD delivers a breakdown of the Double Top chart pattern formed on a four-hour timeframe. The breakdown of the above-mentioned chart pattern triggered after a downside move below the swing low plotted from June 10 low near 0.6100, which results in a bearish reversal.
The 200-period Exponential Moving Average (EMA) near 0.6106 continues to act as a major barricade for the New Zealand Dollar bulls.
The 14-period Relative Strength Index (RSI) rebounds into the 40.00-60.00 range, suggesting that the downside momentum has faded.
A pullback move to near 0.6100 appears to be a selling opportunity for targets towards April 4 high around 0.6050 and the psychological support of 0.6000.
On the contrary, a reversal move above June 12 high of 0.6222, which will expose the asset January 15 high near 0.6250, followed by January 12 high near 0.6280.
NZD/USD four-hour chart
Economic Indicator
Core Personal Consumption Expenditures - Price Index (YoY)
The Core Personal Consumption Expenditures (PCE), released by the US Bureau of Economic Analysis on a monthly basis, measures the changes in the prices of goods and services purchased by consumers in the United States (US). The PCE Price Index is also the Federal Reserve’s (Fed) preferred gauge of inflation. The YoY reading compares the prices of goods in the reference month to the same month a year earlier. The core reading excludes the so-called more volatile food and energy components to give a more accurate measurement of price pressures." Generally, a high reading is bullish for the US Dollar (USD), while a low reading is bearish.
Read more.Last release: Fri Jun 28, 2024 12:30
Frequency: Monthly
Actual: 2.6%
Consensus: 2.6%
Previous: 2.8%
Source: US Bureau of Economic Analysis
After publishing the GDP report, the US Bureau of Economic Analysis releases the Personal Consumption Expenditures (PCE) Price Index data alongside the monthly changes in Personal Spending and Personal Income. FOMC policymakers use the annual Core PCE Price Index, which excludes volatile food and energy prices, as their primary gauge of inflation. A stronger-than-expected reading could help the USD outperform its rivals as it would hint at a possible hawkish shift in the Fed’s forward guidance and vice versa.
Author

Sagar Dua
FXStreet
Sagar Dua is associated with the financial markets from his college days. Along with pursuing post-graduation in Commerce in 2014, he started his markets training with chart analysis.


