NZD/USD Price Analysis: 10-day SMA guards immediate upside
- NZD/USD fails to hold onto recovery gains.
- Wednesday’s bullish spinning top suggests buyers’ exhaustion.
- 23.6% Fibonacci retracement offers nearby support.

Having portrayed buyers’ exhaustion the previous day, via bullish spinning top, NZD/USD remains weak around 0.5840, down 0.18%, amid the early Thursday.
While 10-day SMA restricts the pair’s immediate upside, 23.6% Fibonacci retracement of its yearly fall limits the nearby declines.
However, the bearish MACD coupled with the pullback signaling candlestick formation indicates further downside past 0.5770 immediate support.
In doing so, 0.5670 and 0.5590 may offer intermediate halts before the monthly low near 0.5470.
Meanwhile, an upside clearance past-10-day SMA level of 0.5845 can accelerate the recovery moves towards 0.5930 and 0.6000 during the further advances.
NZD/USD daily chart
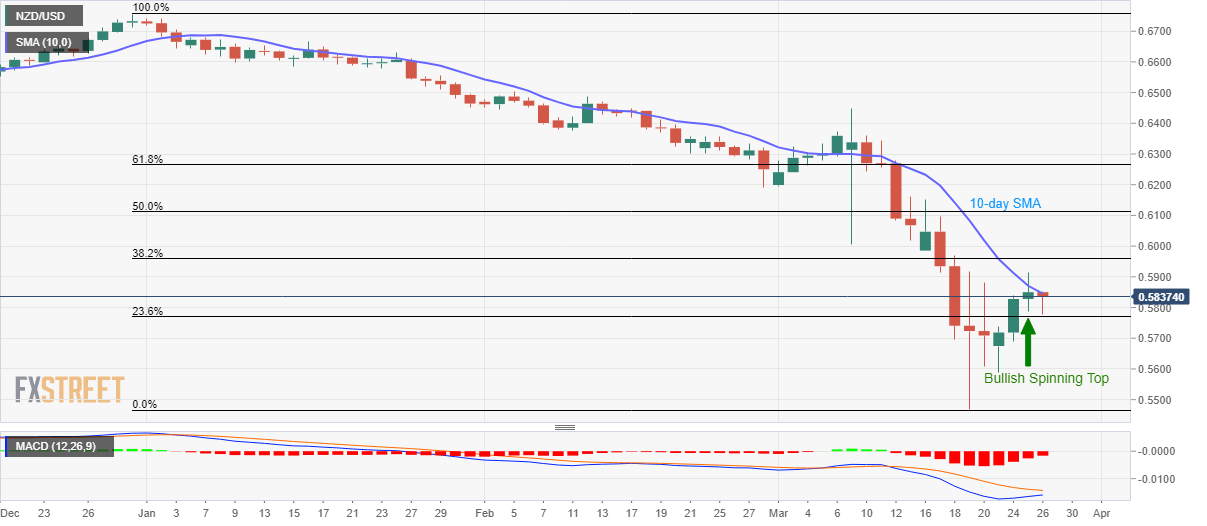
Trend: Pullback expected
Author

Anil Panchal
FXStreet
Anil Panchal has nearly 15 years of experience in tracking financial markets. With a keen interest in macroeconomics, Anil aptly tracks global news/updates and stays well-informed about the global financial moves and their implications.


