|

NZD/USD nosedives to fresh weekly lows, eyeing the YTD low at 0.5996

  • NZD/USD collapsed after US CPI rose higher than estimated, further cementing a large Fed interest rate increase.
  • August inflation in the US flashed signs of being stickier than expected.
  • Traders await NZ Current Account alongside US PPI on Wednesday.

The NZD/USD sinks more than 100 pips or 2% during Tuesday’s North American session, spurred by a hot US inflation reading, which favors the US Federal Reserve’s case of a 75 bps rate hike in the September 20-21 meeting. That, alongside higher US Treasury bond yields and a stronger greenback, triggered a risk-off impulse.

The kiwi began trading around 0.6140 and edged toward the daily high at 0.6161. However, as US economic data was released, the NZD/USD slumped to the daily low at 0.6009 before trimming some of its late losses. At the time of writing, the NZD/USD is trading at 0.6007, down 2.12%.

NZD/USD dropped after elevated US CPI

The US Bureau of Labor (BLS) reported that August inflation rose by 0.1% MoM, highest than estimates of a contraction of 0.1% by market participants, while annually based, it hit the 8.3% threshold, also exceeding expectations. The so-called core Consumer Price Index (CPI), which excludes food and energy, ticked up 0.6% MoM,  above July’s 0.3%, due to higher rent and medical indexed, as reported by the BLS. The year-over-year core CPI rose by 6.3%, more than 5.9% in July.

Elsewhere, market participants have fully priced in a 75 bps rate hike next Wednesday at FOMC’s meeting, while odds of a 100 bps increased to 20% via the CME FedWatch Tool.


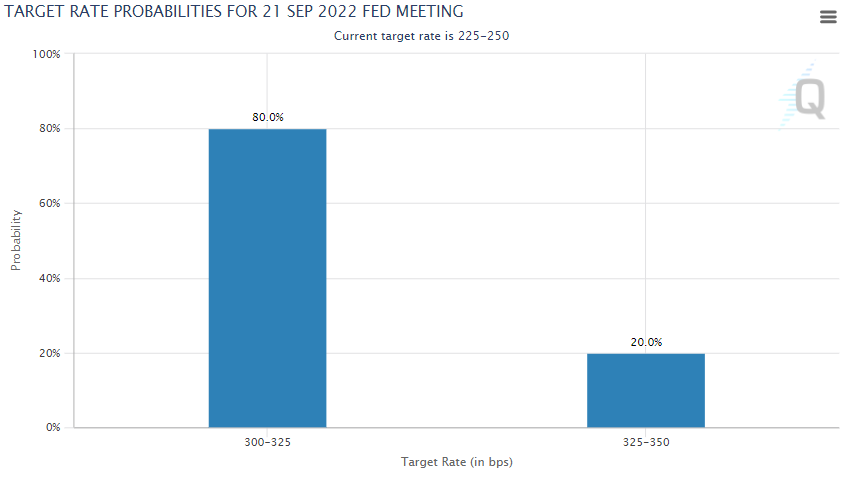
Source: CME FedWatch Tool

In the meantime, the US Dollar Index, a measure of the buck’s performance against a basket of peers, is rallying more than 1%, up at 109.606, underpinned by higher US Treasury yields, like the 10-year benchmark note rate at 3.447%, gaining close to 9 bps.

On the New Zealand side, the ANZ House Price Index fell 1.3% MoM in August, while adjusted sales printed a solid 4.9%. Later in the day, the New Zealand economic docket will reveal the Current Account data for the second quarter.

The US economic docket will feature the Producer Price Index (PPI) for August on Wednesday, with the headline foreseen at -0.1% MoM, while the core PPI is expected at 0.3%.

NZD/USD Key Technical Levels

NZD/USD

Overview
Today last price0.6007
Today Daily Change-0.0126
Today Daily Change %-2.05
Today daily open0.6136
 
Trends
Daily SMA200.6158
Daily SMA500.6211
Daily SMA1000.6298
Daily SMA2000.654
 
Levels
Previous Daily High0.6159
Previous Daily Low0.6084
Previous Weekly High0.6153
Previous Weekly Low0.5996
Previous Monthly High0.647
Previous Monthly Low0.6101
Daily Fibonacci 38.2%0.613
Daily Fibonacci 61.8%0.6112
Daily Pivot Point S10.6093
Daily Pivot Point S20.6051
Daily Pivot Point S30.6018
Daily Pivot Point R10.6169
Daily Pivot Point R20.6202
Daily Pivot Point R30.6244

Author

Christian Borjon Valencia

Christian Borjon began his career as a retail trader in 2010, mainly focused on technical analysis and strategies around it. He started as a swing trader, as he used to work in another industry unrelated to the financial markets.

More from Christian Borjon Valencia
Share:

Markets move fast. We move first.

Orange Juice Newsletter brings you expert driven insights - not headlines. Every day on your inbox.

By subscribing you agree to our Terms and conditions.

Editor's Picks

EUR/USD bears await break below 100-day SMA support near 1.1665 area

The EUR/USD pair attracts heavy selling for the second straight day and dives to a nearly four-week trough, around the 1.1670 region, during the Asian session on Monday. Bearish traders now await a sustained break below the 100-day Simple Moving Average before positioning for an extension of the recent pullback from a three-month top, or levels just above the 1.1800 mark touched on December 24.

GBP/USD falls toward 1.3400 near 50-day EMA

GBP/USD extends its losses for the second successive session, trading around 1.3420 during the Asian hours on Monday. The technical analysis of the daily chart indicates that the 14-day Relative Strength Index at 53 has eased from near overbought, indicating that momentum has cooled while remaining above the midline. RSI holds above 50, keeping a modest bullish bias.

Gold on fire at the start of the week on US-Venezuela tensions

Gold regains upside traction early Monday as flight to safety prevails on Venezuela turmoil. The US Dollar finds strong haven demand, caps Gold’s upside as focus shifts to US jobs data. Gold’s daily technical setup suggests that more upside remains in the offing.

Bulls firmly in control as Bitcoin breaks $93K, Ethereum and Ripple extend gains

Bitcoin, Ethereum, and Ripple extended their rallies on Monday, gaining more than 4%, 6%, and 12%, respectively, in the previous week. The top three cryptocurrencies by market capitalization could continue to outperform, with bulls in control of the momentum.

Economic outlook 2026-2027 in advanced countries: Solidity test

After a year marked by global economic resilience and ending on a note of optimism, 2026 looks promising and could be a year of solid economic performance. In our baseline scenario, we expect most of the supportive factors at work in 2025 to continue to play a role in 2026.

Bitcoin, Ethereum, Ripple – Bulls firmly in control as BTC breaks $93K, ETH and XRP extend gains

Bitcoin, Ethereum, and Ripple extended their rallies on Monday, gaining more than 4%, 6%, and 12%, respectively, in the previous week. The top three cryptocurrencies by market capitalization could continue to outperform, with bulls in control of the momentum.