NZD/USD hits three-day high despite US data and Fed hike expectations
- NZD/USD breaks prior's day high and eyes a test of the 20-day EMA at 0.6188.
- The core PCE, the Fed's preferred gauge for inflation, remains stickier, warranting a Fed hike at the May meeting.
- NZD/USD Price Analysis: Downtrend risks negation as NZD/USD eyes 0.6200 with 200-day EMA hovering near 0.6220s.

The NZD/USD extends its uptrend, hitting a three-day high at around 0.6172, as buyers see a break above technical resistance at the 20-day EMA. Although data from the United States (US) further cemented the case for a Federal Reserve (Fed) hike, the New Zealand Dollar (NZD) advances steadily. At the time of writing, the NZD/USD is trading at 0.6182.
NZD/USD breaks prior's day high and targets 0.6188, while Fed's core PCE supports May rate hike
The US Department of Commerce (DoC) revealed that inflation in the United States decelerated, with the Personal Consumption Expenditure (PCE) slowing from 5.1% to 4.2% in YoY readings, while for a monthly basis, edged to 0.1%, below the prior's month 0.3%. Meanwhile, the Fed's preferred gauge for inflation, the core PCE, stood at 4.6% YoY, unchanged compared to the last month's data.
Given the backdrop, investors stood convinced that the Fed would raise rates, as shown by the CME FedWatch Tool. Odds for a 25 bps increase lie at 88.3%, above yesterday's 83.9% chances. Nevertheless, US T-bond yields edged lower, with 2s down 3.5 bps at 4.039%, while 10s dropped 7.5 bps at 3.448%.
Another piece of the puzzle that added to inflationary pressures standing still is the Employment Cost Index (ECI) revealed by the US Department of Labor. The ECI rose from 1.1% in the previous quarter to 1.2% in Q1, 2023.
In other data, the University of Michigan (UoM) Consumer Sentiment remained unchanged at 63.5. Inflation expectations for 1-year stood at 4.6%, and for a 5-year horizon at 3%.
In the meantime, the US Dollar Index (DXY), which measures the performance of six currencies against the American Dollar (USD), has erased some of its earlier gains and remains above its opening price by 0.10%< at 101.583.
On the New Zealand front, the ANZ Roy Morgan Consumer Confidence Index improved to 79.3 in April from 77.7 in March of 2023, though it remained at low levels as people remained concerned about elevated prices
NZD/USD Technical Analysis
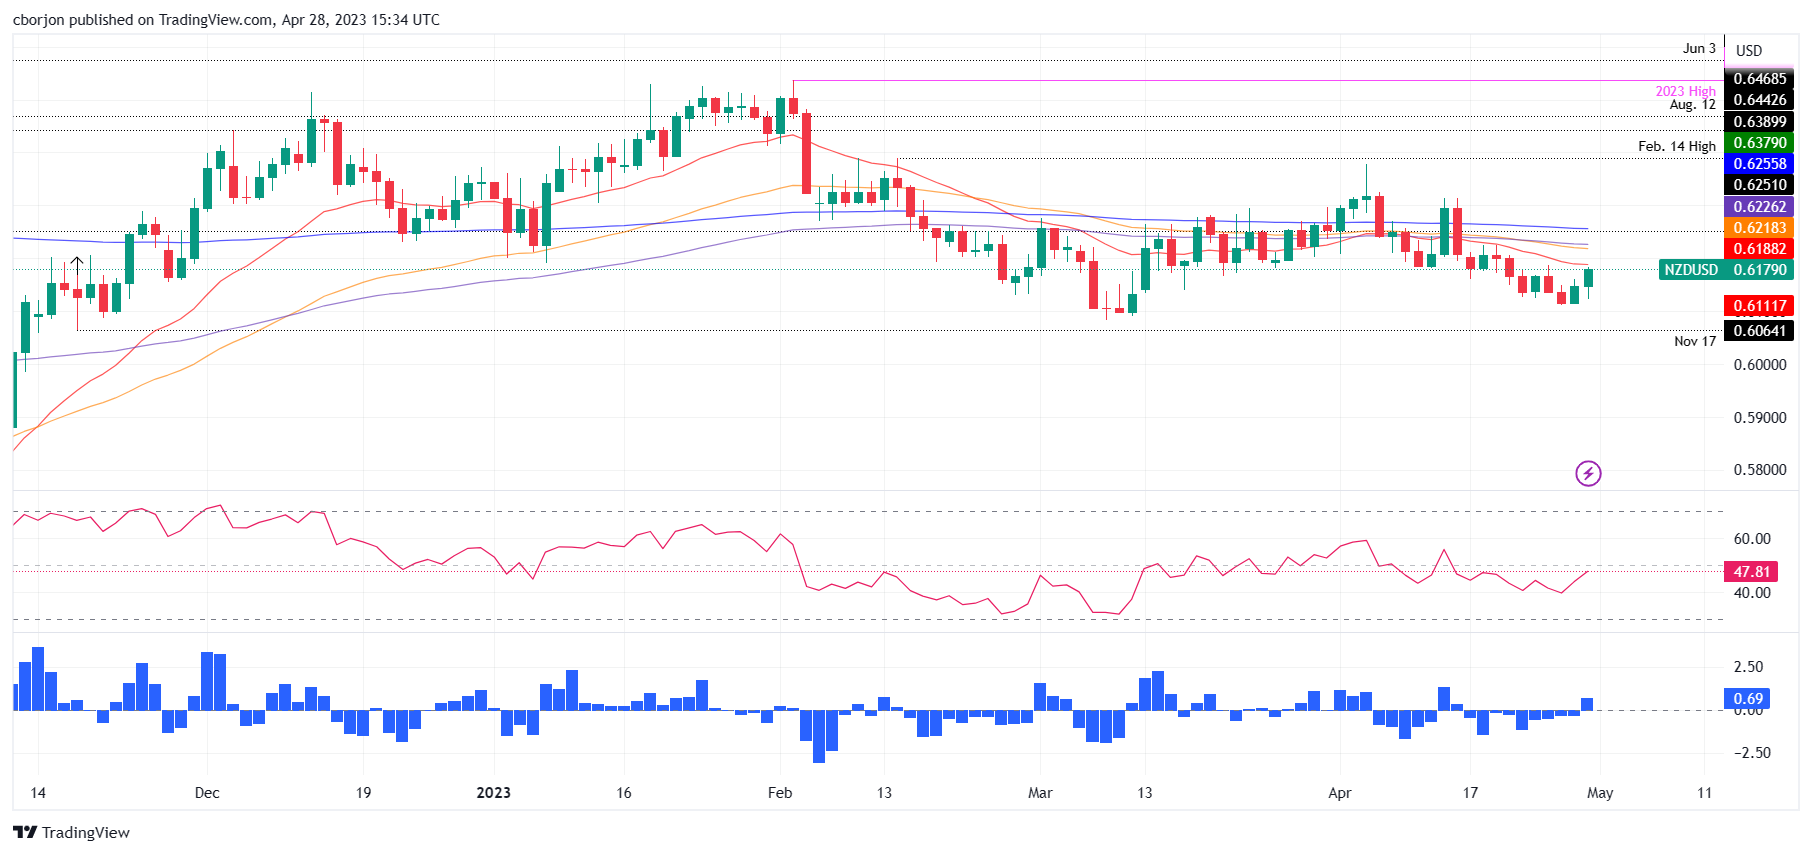
From a technical perspective, the NZD/USD is still in a downtrend though it has recovered some ground. The 20-day Exponential Moving Average (EMA) at 0.6187 would be the first resistance that buyers will test as they aim toward 0.6200. Once broke, the latter will be challenged, as the 100-day EMA at 0.6218 would appear in front of the bulls. The downtrend would be at risk at the 200-day EMA at 0.6226. On the flip side, if NZD/USD drops below the April 27 high of 0.6161, further downside is expected.
Author

Christian Borjon Valencia
FXStreet
Markets analyst, news editor, and trading instructor with over 14 years of experience across FX, commodities, US equity indices, and global macro markets.


