- The NZD/USD showed a strong downward swing, falling near the 0.6060 level.
- US Nonfarm Payrolls added 353K jobs in January surpassing by a wide margin the expectations.
- The bets of a rate cut in March sharply declined and markets pushed the start of the easing to May.
In Friday's trading session, the NZD/USD took a steep turn downwards, landing at a rough level of 0.6060. The pronounced downward trajectory resulted from a surprisingly strong US Nonfarm Payrolls report that pushed the pair into bearish domain as markets gave up the hopes of sooner rate cuts by the Federal Reserve (Fed). For the week, the pair closed a 0.40% weekly loss.
The US Bureau of Labor Statistics reported that the Nonfarm Payrolls for January presented a robust picture with a significant increase of 353K compared to the consensus figure of 180K and the previous 333K. The Average Hourly Earnings in January increased by 0.6%, outstripping the anticipated 0.3% and the preceding 0.4% respectively while the yearly measure soared to a 4.5%, higher than the prior 4.4% and beating the expected 4.1%. Lastly, the Unemployment Rate for January remained steady at 3.7%, which aligns with its previous figure and was slightly lower than the anticipated 3.8%.
As a reaction, the US bond rose across the board as markets start to prepare for the easing cycle of the Fed to start in May rather than in March. The 2-year rate is currently standing at 4.37%, with the 5 and 10-year yields observed at 4% and 4.05% respectively. As per historical financial trends, a rise in yields generally tends to fortify the USD's position as it is more appealling for foreign investors.
In line with that, the CME FedWatch Tool showed a significant drop in the likelihood of a March interest rate cut, with estimates now standing at just 20% while the odds of a cut in the following May meeting rose to nearly 58%.
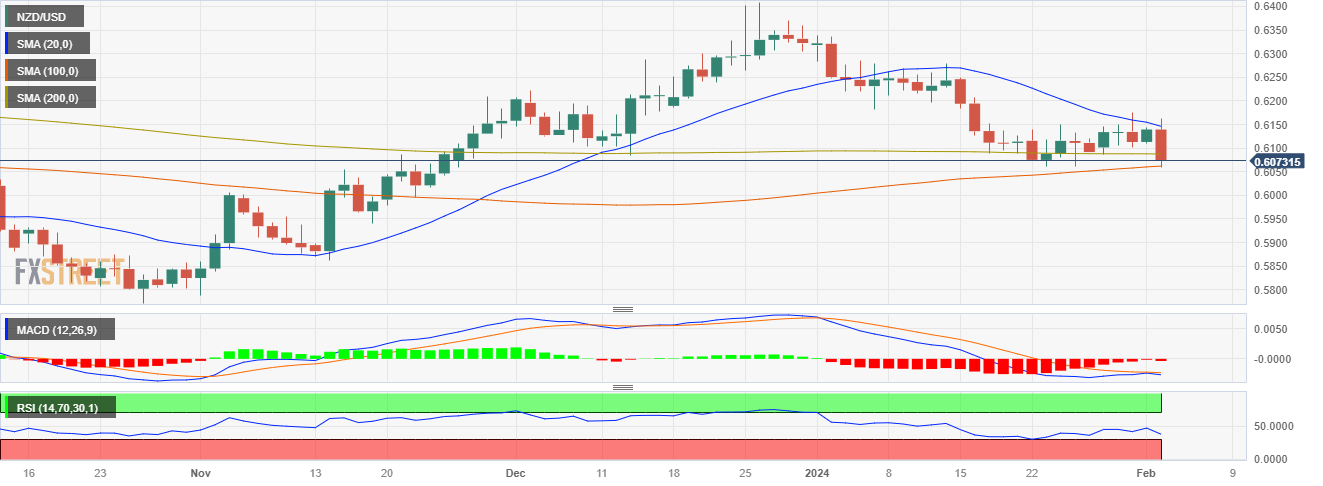
NZD/USD levels to watch
The daily chart suggests that the pair has a bearish bias, at least in the short-term. Indicators signal declining buying power, as depicted by the negative slope and negative territory in the Relative Strength Index (RSI). Adding to that the histogram of the Moving Average Convergence Divergence (MACD) displays rising red bars, hinting that the overall momentum favors the sellers.
Looking at the pair's position relative to moving averages, it is trading below the 20-day and 200-day Simple Moving Averages (SMAs), another sign of bearish sentiment. Yet, interestingly, it sits above the 100-day SMA, indicating that the bulls are maintaining a bullish grip on the broader outlook.
Information on these pages contains forward-looking statements that involve risks and uncertainties. Markets and instruments profiled on this page are for informational purposes only and should not in any way come across as a recommendation to buy or sell in these assets. You should do your own thorough research before making any investment decisions. FXStreet does not in any way guarantee that this information is free from mistakes, errors, or material misstatements. It also does not guarantee that this information is of a timely nature. Investing in Open Markets involves a great deal of risk, including the loss of all or a portion of your investment, as well as emotional distress. All risks, losses and costs associated with investing, including total loss of principal, are your responsibility. The views and opinions expressed in this article are those of the authors and do not necessarily reflect the official policy or position of FXStreet nor its advertisers. The author will not be held responsible for information that is found at the end of links posted on this page.
If not otherwise explicitly mentioned in the body of the article, at the time of writing, the author has no position in any stock mentioned in this article and no business relationship with any company mentioned. The author has not received compensation for writing this article, other than from FXStreet.
FXStreet and the author do not provide personalized recommendations. The author makes no representations as to the accuracy, completeness, or suitability of this information. FXStreet and the author will not be liable for any errors, omissions or any losses, injuries or damages arising from this information and its display or use. Errors and omissions excepted.
The author and FXStreet are not registered investment advisors and nothing in this article is intended to be investment advice.
Recommended content
Editors’ Picks
AUD/USD loses ground due to the absence of a hawkish RBA
The Australian Dollar has plunged following the Reserve Bank of Australia's decision to maintain its interest rate at 4.35% on Tuesday. Investors sentiment leaned toward a potentially more hawkish stance from the RBA, particularly after last week's inflation data surpassed expectations.
EUR/USD edges lower to near 1.0750 after hawkish remarks from a Fed official
EUR/USD extends its losses for the second successive session, trading around 1.0750 during the Asian session on Wednesday. The US Dollar gains ground due to the expectations of the Federal Reserve’s prolonging higher interest rates.
Gold price recovers its recent losses, despite a firmer US Dollar
Gold price attracts some buyers during the Asian trading hours on Wednesday. Safe-haven demand, fueled by geopolitical tensions and uncertainty, as well as ongoing central bank purchases, might contribute to a rally in gold.
FTX files consensus-based plan of reorganization, awaits bankruptcy court approval
FTX has filed a consensus-based plan for its reorganization, coming almost two years after the now defunct FTX filed for Chapter 11 Bankruptcy Protection in the District of Delaware.
No obvious macro catalysts to steer the bus
The US data calendar remains relatively light, with initial jobless claims and the University of Michigan survey being the key focus. However, these releases may not provide a significant catalyst for the next directional move in the US Dollar.