Nvidia Stock Forecast: After five consecutive weeks of gains, NVDA hits new all-time high on Monday
- Nvidia stock briefly overtook Amazon's market cap on Monday.
- NVDA stock has gained for five consecutive weeks and is up 45% YTD.
- Beamr Imaging stock rose 700% after announcing joint research with Nvidia.
- Arm Holdings stock has gained more than 20% on Monday.
Nvidia (NVDA) stock on Monday became the fourth most valuable US public company for a brief time after momentarily overtaking Jeff Bezos' crown jewel. The market capitalization of Nvidia closed the day at $1.785 trillion, just shy of the Amazon (AMZN) market cap of $1.79 trillion. However, Nvidia took the lead around 11:30AM EST for a few minutes before traders booked profits after lunchtime and Nvidia moved back into fifth place. The last time Nvidia was worth more than Amazon was in 2002, and both companies at that time were worth less than $10 billion.
NVDA stock traded up as much as 3.4% on Monday but closed the first day of the week up a more moderate 0.16% at $722.48. NVDA stock then sold off four-tenths of a percent afterhours to trade below $720. The post-market was overshadowed by surprising earnings results from ZoomInfo Technologies (ZI), which surged 23% afterhours.
The market was mixed on Monday afternoon as the Dow Jones gained 0.33%, while the NASDAQ Composite lost 0.3% and the S&P 500 shed 0.09% ahead of Tuesday’s Consumer Price Index (CPI) print for January.
Nvidia stock news
Nvidia stock has been on an absolute tear of late. The past five consecutive weeks have seen the semiconductor stock notch new all-time highs, and four of the five weeks witnessed gains exceeding 8%.
Nvidia stock is up 45% year to date, which leads all other mega-cap tech stocks among the vaunted Magnificent Seven. The market is more than excited to look under the hood of CEO Jensen Huang's megalith when Nvidia releases quarterly results next Wednesday, February 21.
The eagerness pushing up the NVDA stock price comes from a mix of factors. But generally the market has sidelined prior worries about a glut of AI-focused chips on the market, uncertainty of Nvidia's supply keeping up and the Biden administration’s tech-related sanctions on China.
Earlier this month a Goldman analyst wrote that prior expectations of a pullback in server chip demand were unfounded, and Goldman raised its NVDA stock price target from $620 to $800.
Bank of America Securities strategist Michael Hartnett referenced in a client note that Nvidia has grown its market cap over the past two months by the market cap of Tesla (TSLA), which is valued at $600 billion.
In other news, Israeli video encoder Beamr Imaging (BMR) saw its stock rise over 700% on Monday after it announced that it would present new research alongside Nvidia researchers at the ACM Mile-High-Video 2024 this week. Beamr Imaging is scheduled to release its new video cloud service that runs on Nvidia hardware on February 20.
Nvidia was not the only semiconductor company reaching new heights on Monday either. Arm Holdings (ARM) is following up its 48% run last Thursday, the product of its first earnings release as a newly public company, with a 23% gain here on Monday.
Semiconductor stocks FAQs
What is a semiconductor?
A semiconductor is a term for various types of computer chips. Officially called semiconductor devices, these computer chips rely on semiconductor materials like silicon and gallium arsenide to process the electrical current that produces the modern world of computing. They come in many shapes, sizes, enhancements and configurations such as diodes, transistors and integrated circuits to more complicated applications like DRAM memory, simple processors and even GPUs.
What types of semiconductor companies are there?
First, there are the pure chip designers, such as Nvidia, AMD, Broadcom and Qualcomm. These companies use sophisticated software to design and test chips. Second, there are the equipment manufacturers that provide the machines necessary to build computer chips. These include ASML and Lam Research. Then, there are foundries that manufacture the chips. These include Taiwan Semiconductor and GlobalFoundries. Last of all are the integrated device manufacturers who design their own chips and additionally manufacture themselves. These include Samsung and Intel.
What is Moore’s Law?
It is the observation that the number of transistors in an integrated circuit doubles every two years. The “law” is named after Gordon Moore, who founded Fairchild Semiconductor and later Intel. The doubling is possible due to the shrinking size of process nodes or parts in the computer chip. In 1971 the advanced commercial manufacturing had reached 10 microns in width. In 1987 semiconductor technology had advanced to 800 nanometers in width. By 1999, this process had moved to 180 nanometers. By 2007, the size had dropped to 32 nanometers, and this fell all the way to 3 nanometers in 2022, which is close to the size of human DNA.
How large is the semiconductor industry?
In 2022, the global semiconductor industry had revenues just under $600 billion. In total, the industry shipped 1.15 trillion semiconductor units in 2021. The leading nations involved in the semiconductor supply chain are Taiwan, the United States, China, the Netherlands, South Korea, Japan and Israel.
Nvidia stock forecast
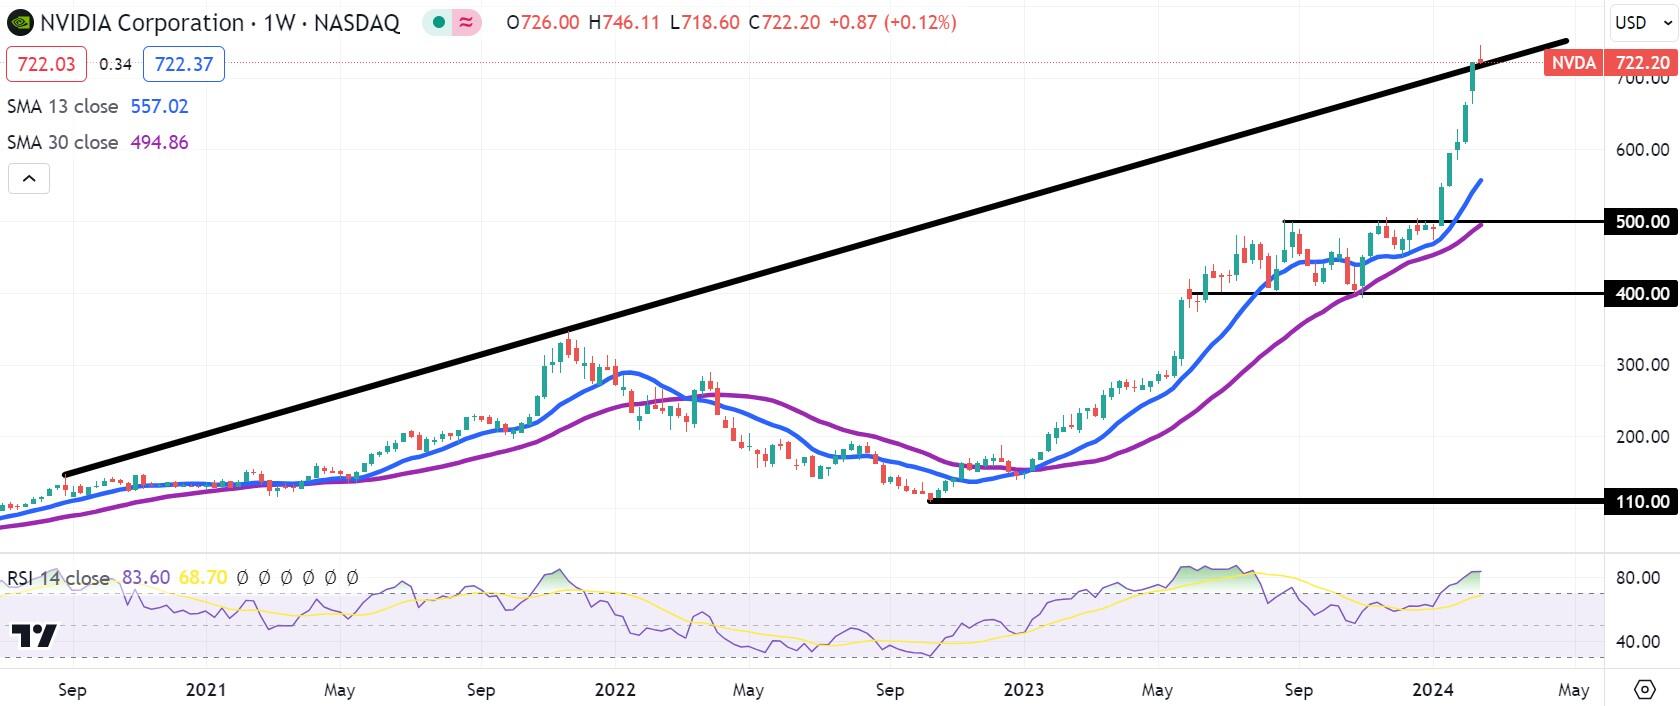
Nvidia stock reached a new all-time high on Monday at $746.11. The fact that NVDA stock almost immediately reached resistance here is not surprising.
The price action directly corresponds to the ascending upper trendline that began in 2020 and then was retested in late 2021. After the long sell-off of 2022 and 2023's extreme rebound, NVDA stock has returned to this trendline in the vicinity of $725.
Nvidia stock did briefly break above the top trendline, so it seems plausible that bulls might turn the long-term trendline into a support structure. But the main obstacle would seem to be the weekly chart’s Relative Strength Index (RSI). It is looking exceedingly overbought at present, so some level of consolidation would appear to be the more obvious course.
NVDA daily stock chart
Premium
You have reached your limit of 3 free articles for this month.
Start your subscription and get access to all our original articles.
Author

Clay Webster
FXStreet
Clay Webster grew up in the US outside Buffalo, New York and Lancaster, Pennsylvania. He began investing after college following the 2008 financial crisis.


