New Zealand Dollar extends upside amid softer US Dollar, rising Fed rate cut expectations
- The New Zealand Dollar extends its rally in Monday’s early European session.
- Rising bets of a Fed rate cut in September drag the USD lower and support the pair.
- Traders await New Zealand’s Trade Balance data and the PBoC interest rate decision on Tuesday for fresh impetus.

The New Zealand Dollar (NZD) gathers strength near one-month high on Monday. The weaker US housing data on Friday has added to concerns over the US economy's strength, especially after recent softer inflation and labor reports. Traders place more bets on interest rate cuts from the US Federal Reserve in September, which undermine the US Dollar (USD) and create a tailwind for NZD/USD.
However, the dovish stance of the Reserve Bank of New Zealand (RBNZ) after a surprise rate cut last week might weigh on the Kiwi as the easing cycle came much sooner than expected. Additionally, any signs of a weaker Chinese economy might cap the upside for China’s proxy NZD as China is New Zealand's largest trading partner.
Traders will monitor New Zealand’s Trade Balance data and the People’s Bank of China’s (PBoC) interest rate decision on Tuesday. The highlight this week will be Fed Chair Powell's speech at the Jackson Hole symposium on Friday. This event might offer some hints about guidance on the pace of Fed easing.
Daily Digest Market Movers: New Zealand Dollar gains traction amid Fed rate cuts hope
- New Zealand’s Business NZ Performance of Services Index (PSI) improved to 44.6 in July from the previous reading of 40.7, according to Business NZ on Monday.
- RBNZ Governor Adrian Orr said on Friday that the committee has achieved a very strong level of confidence that low and stable inflation is back within the 1-3% range.
- The preliminary University of Michigan Consumer Sentiment Index improved to 67.8 in August from the previous reading of 66.4, above the market consensus of 66.9. This figure rose for the first time in five months.
- The US Housing Starts declined by 6.8% in July to 1.238 million units, compared to the 1.1% increase in June, while the Building Permits decreased by 4.0% in July after rising 3.9% in June.
- Federal Reserve Bank of Chicago President Austan Goolsbee said on Sunday that the US economy does not show signs of overheating, so Fed policymakers should be cautious about keeping restrictive policy in place longer than necessary.
- San Francisco Fed President Mary Daly said that the US central bank needs to take a gradual approach to lowering borrowing costs, per Financial Times.
Technical Analysis: New Zealand Dollar’s uptrend is likely to resume
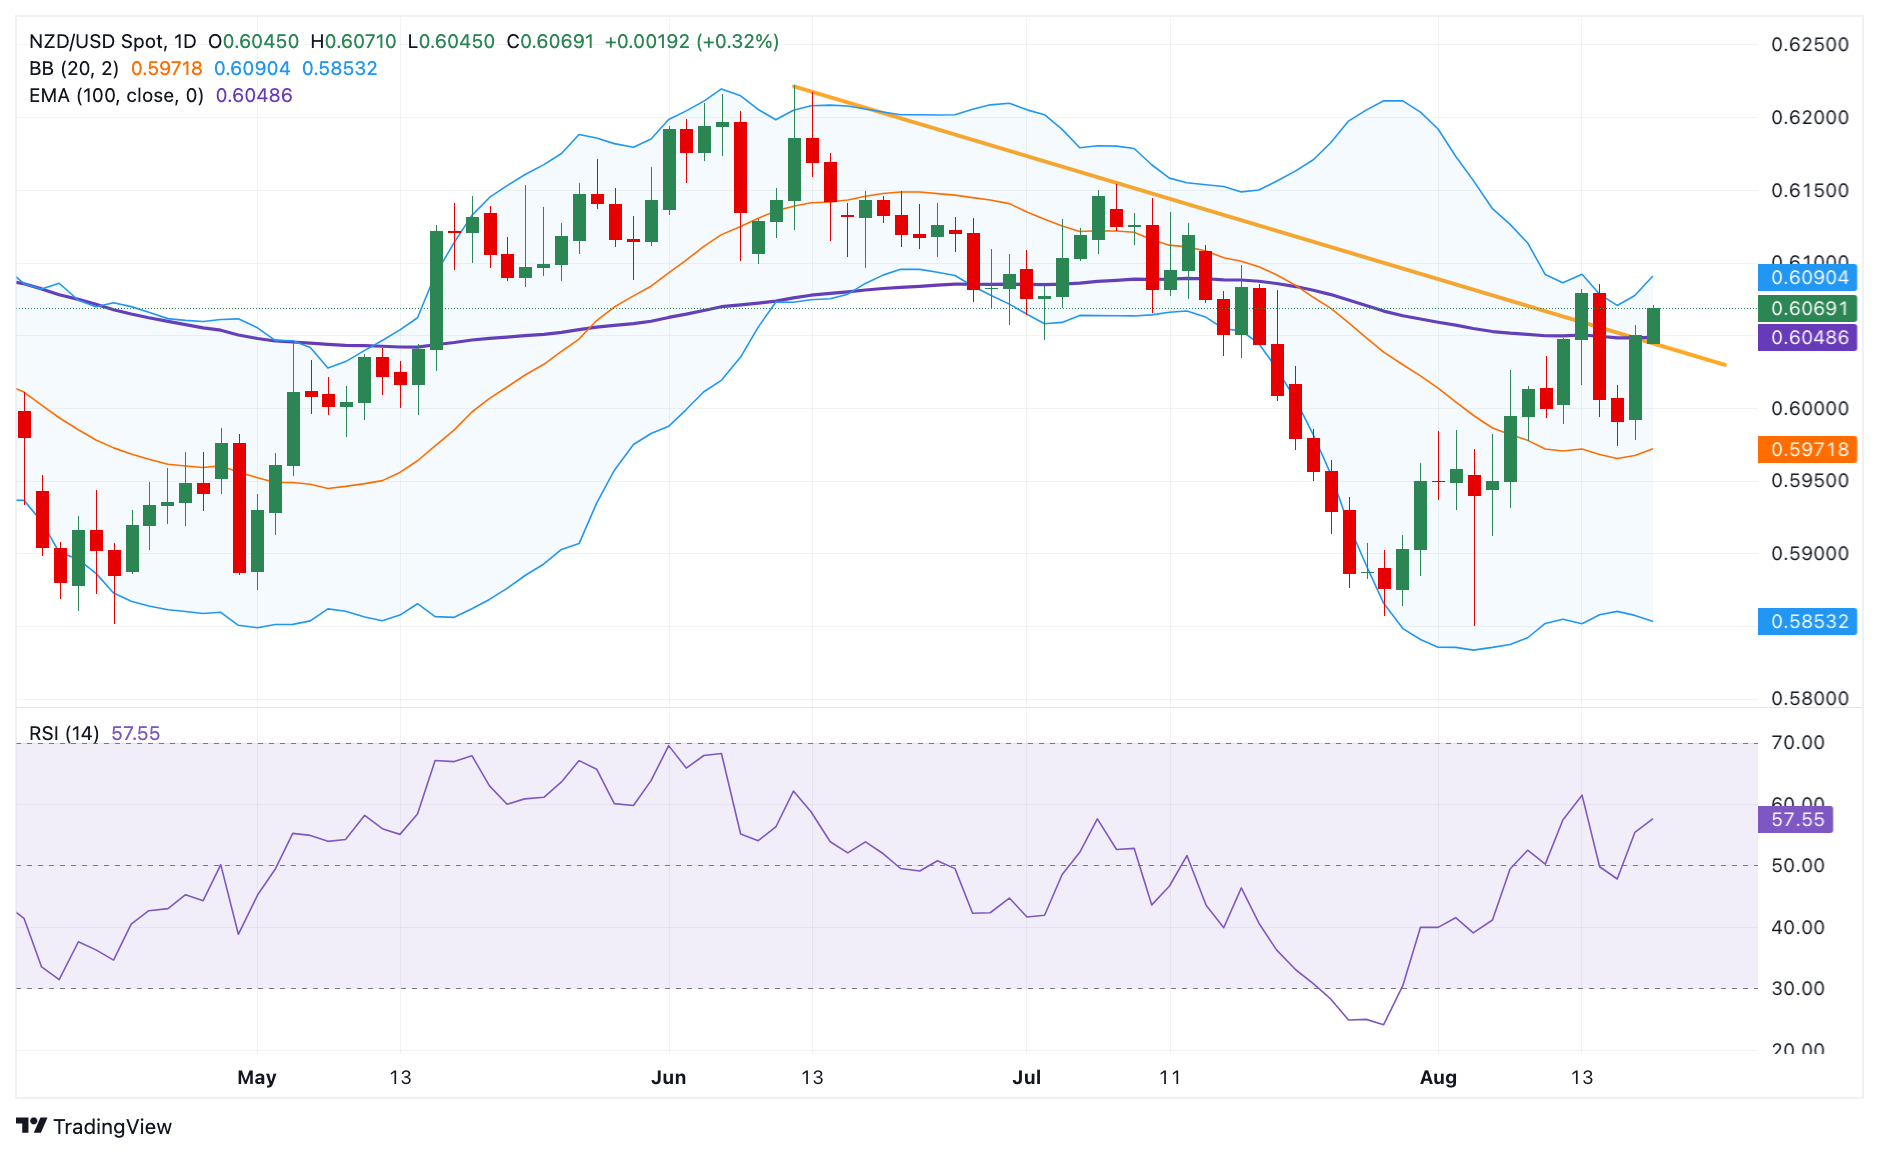
The New Zealand Dollar trades on a stronger note on the day. The NZD/USD pair seems set to close above the key 100-day Exponential Moving Average (EMA) and descending trendline on the daily chart. If the pair decisively closes above this level, it will resume the uptrend. The 14-day Relative Strength Index (RSI) points higher above the midline near 56.60, the potential for further upside.
The immediate resistance levels to watch are the 0.6085-0.6090 zone, representing the high of August 14 and the upper boundary of the Bollinger Band. Sustained trading above this level could see a rally to 0.6154, the high of July 8. The next barrier is seen at 0.6222, the high of June 12.
On the other hand, the confluence of the 100-day EMA and descending trendline of 0.6048 acts as an initial support level for NZD/USD. The additional downside filter to watch is 0.5974, the low of August 15. Any follow-through selling will see a drop to 0.5853, the lower limit of the Bollinger Band.
US Dollar price in the last 7 days
The table below shows the percentage change of US Dollar (USD) against listed major currencies in the last 7 days. US Dollar was the weakest against the Australian Dollar.
| USD | EUR | GBP | CAD | AUD | JPY | NZD | CHF | |
| USD | -1.17% | -1.60% | -0.53% | -1.78% | -0.57% | -1.44% | -0.15% | |
| EUR | 1.15% | -0.42% | 0.63% | -0.59% | 0.59% | -0.26% | 1.01% | |
| GBP | 1.57% | 0.42% | 1.05% | -0.18% | 1.01% | 0.15% | 1.41% | |
| CAD | 0.52% | -0.64% | -1.06% | -1.23% | -0.04% | -0.91% | 0.38% | |
| AUD | 1.76% | 0.60% | 0.17% | 1.22% | 1.18% | 0.33% | 1.60% | |
| JPY | 0.58% | -0.59% | -1.02% | 0.03% | -1.18% | -0.84% | 0.43% | |
| NZD | 1.42% | 0.27% | -0.16% | 0.90% | -0.32% | 0.85% | 1.26% | |
| CHF | 0.14% | -1.03% | -1.46% | -0.39% | -1.62% | -0.43% | -1.30% |
The heat map shows percentage changes of major currencies against each other. The base currency is picked from the left column, while the quote currency is picked from the top row. For example, if you pick the Euro from the left column and move along the horizontal line to the Japanese Yen, the percentage change displayed in the box will represent EUR (base)/JPY (quote).
Interest rates FAQs
Interest rates are charged by financial institutions on loans to borrowers and are paid as interest to savers and depositors. They are influenced by base lending rates, which are set by central banks in response to changes in the economy. Central banks normally have a mandate to ensure price stability, which in most cases means targeting a core inflation rate of around 2%. If inflation falls below target the central bank may cut base lending rates, with a view to stimulating lending and boosting the economy. If inflation rises substantially above 2% it normally results in the central bank raising base lending rates in an attempt to lower inflation.
Higher interest rates generally help strengthen a country’s currency as they make it a more attractive place for global investors to park their money.
Higher interest rates overall weigh on the price of Gold because they increase the opportunity cost of holding Gold instead of investing in an interest-bearing asset or placing cash in the bank. If interest rates are high that usually pushes up the price of the US Dollar (USD), and since Gold is priced in Dollars, this has the effect of lowering the price of Gold.
The Fed funds rate is the overnight rate at which US banks lend to each other. It is the oft-quoted headline rate set by the Federal Reserve at its FOMC meetings. It is set as a range, for example 4.75%-5.00%, though the upper limit (in that case 5.00%) is the quoted figure. Market expectations for future Fed funds rate are tracked by the CME FedWatch tool, which shapes how many financial markets behave in anticipation of future Federal Reserve monetary policy decisions.
Author

Lallalit Srijandorn
FXStreet
Lallalit Srijandorn is a Parisian at heart. She has lived in France since 2019 and now becomes a digital entrepreneur based in Paris and Bangkok.

















