Natural Gas salvages earlier decline and is back at its winning streak
- Natural Gas prices are recovering again ahead of the US Opening Bell
- European inflation numbers point to more downturn and European economy slowing down.
- The US Dollar Index trades around 104 ahead of the US opening bell.

Natural Gas (XNG/USD) is back in the green with buyers that came in and bought the dip that took place ahead of the US data release. The earlier downturn came with recent inflation numbers out of Europe where disinflation is ongoing, though is starting to show signs of a slowing down economy. That would mean quite some substantial demand not coming back online anytime soon in Europe with Industrial Production remaining tepid for now in Europe.
Meanwhile, the US Dollar (USD) is unable to move away from a key level at 104.00 in the US Dollar Index. The Personal Consumption Expenditures numbers fell in line and are showing that the disinflation path for the US is still in tact. Though the muted market reaction points to traders keeping their powder dry for the central bank meetings in March.
Natural Gas is trading at $1.92 per MMBtu at the time of writing.
Natural Gas market movers: Save the day
- LNG flows into Europe have been 16% higher than the 30-day average these past few days, according to Bloomberg.
- European gas storages are still filled up to nearly 63% as the heating season in the old continent comes to an end.
- Freeport LNG in Texas has reported that it will need to extend its production of LNG another two weeks after issues with its Train 3 unit.
- At 15:30 GMT, the weekly Natural Gas Storage Change will be released by the Energy Information Administration. The previous number was a draw of 60 Billion cubic feet, with expectations for a larger draw of 88 Billion cubic feet for this week.
Natural Gas Technical Analysis: Scooping up bargains in European gas market
Natural Gas prices are already pricing in the fact that more Asian trading desks and companies are trying to set foot in Europe to get their hands on substantially cheaper Gas contracts. Meanwhile, the European supply out of the US could be at risk as deliveries to Asia become more beneficial for US sellers, with Asian handlers willing to pay more for US gas than Europe is at the moment. This could soon see the scale tipping into less supply. Combined with an overcrowded demand, this could mean Gas prices soaring further above $2.
On the upside, Natural Gas is facing some pivotal technical levels to get back to. The next step is $1.99, – the level which, when broken on the way down, saw an accelerated decline. After that, the green line at $2.13 comes into view, with the triple bottoms from 2023. If Natural Gas sees a sudden demand pickup, $2.40 could come into play.
On the downside, $1.64 and $1.53 (the low of 2020) are targets to look out for. Another leg lower could come if global growth starts to falter and there is less demand. Adding to that equation, more volume of Natural Gas from the US and Canada could quickly tip into an oversupplied market with more downside prices at hand.
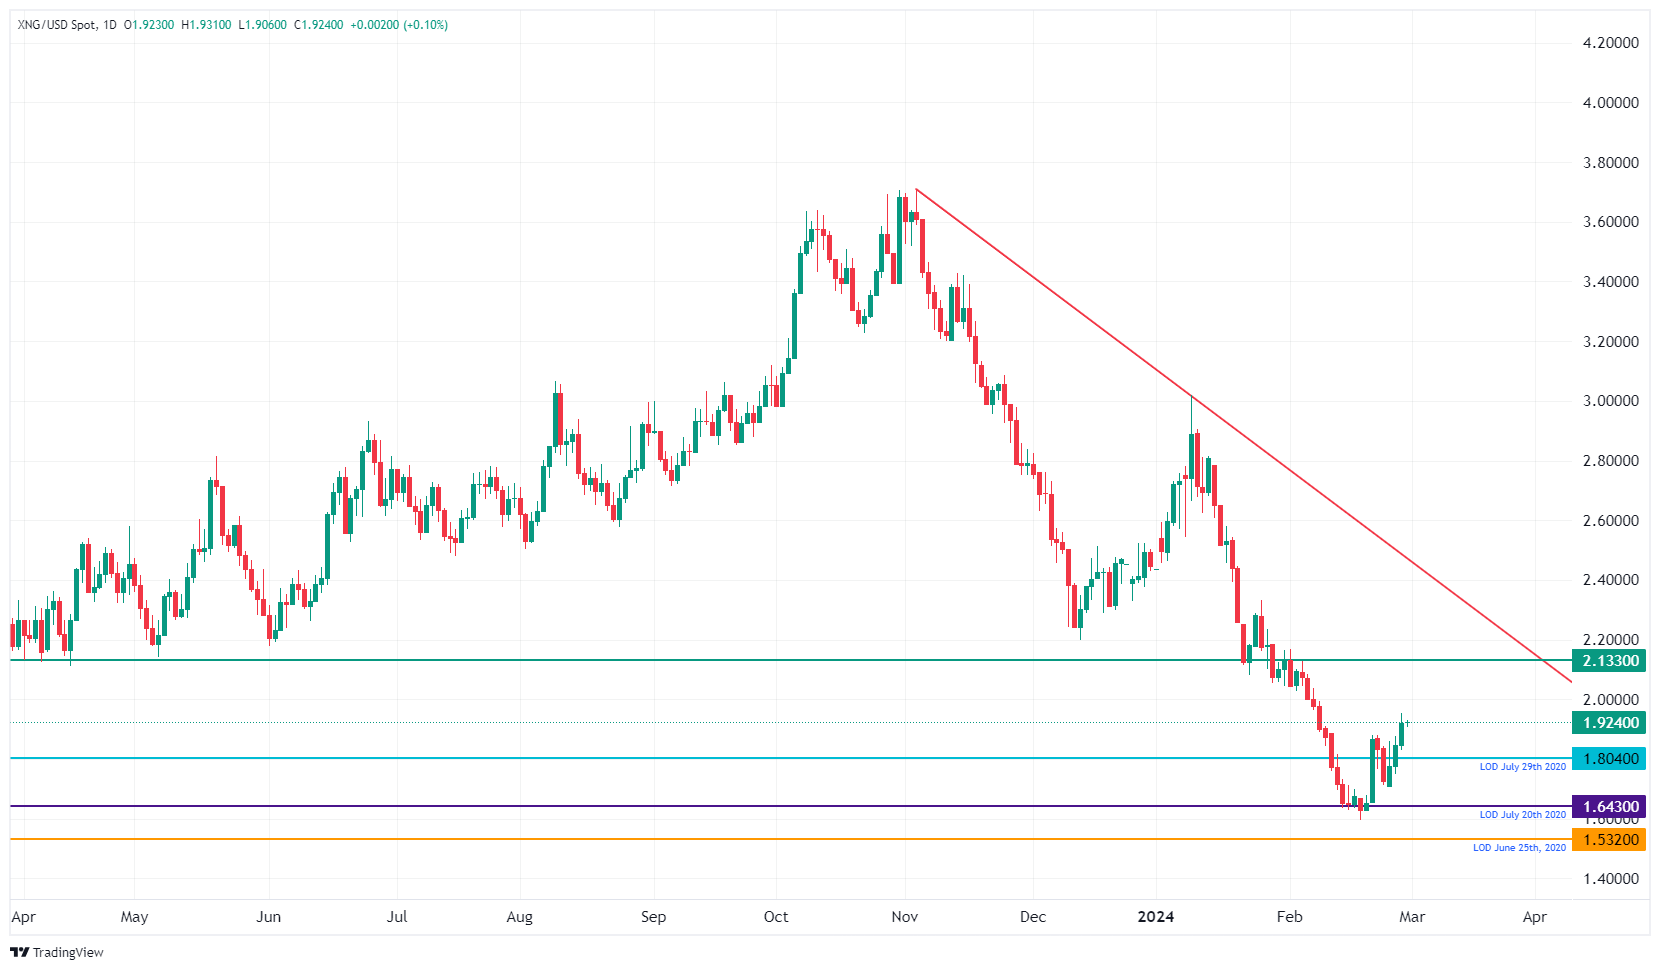
XNG/USD (Daily Chart)
Natural Gas FAQs
What fundamental factors drive the price of Natural Gas?
Supply and demand dynamics are a key factor influencing Natural Gas prices, and are themselves influenced by global economic growth, industrial activity, population growth, production levels, and inventories. The weather impacts Natural Gas prices because more Gas is used during cold winters and hot summers for heating and cooling. Competition from other energy sources impacts prices as consumers may switch to cheaper sources. Geopolitical events are factors as exemplified by the war in Ukraine. Government policies relating to extraction, transportation, and environmental issues also impact prices.
What are the main macroeconomic releases that impact on Natural Gas Prices?
The main economic release influencing Natural Gas prices is the weekly inventory bulletin from the Energy Information Administration (EIA), a US government agency that produces US gas market data. The EIA Gas bulletin usually comes out on Thursday at 14:30 GMT, a day after the EIA publishes its weekly Oil bulletin. Economic data from large consumers of Natural Gas can impact supply and demand, the largest of which include China, Germany and Japan. Natural Gas is primarily priced and traded in US Dollars, thus economic releases impacting the US Dollar are also factors.
How does the US Dollar influence Natural Gas prices?
The US Dollar is the world’s reserve currency and most commodities, including Natural Gas are priced and traded on international markets in US Dollars. As such, the value of the US Dollar is a factor in the price of Natural Gas, because if the Dollar strengthens it means less Dollars are required to buy the same volume of Gas (the price falls), and vice versa if USD strengthens.
Author

Filip Lagaart
FXStreet
Filip Lagaart is a former sales/trader with over 15 years of financial markets expertise under its belt.


