Natural Gas turns flat in very mild price action on Monday after Norway's outage
- Natural Gas flirts with break below $2.80 on Monday, near last week’s support.
- Traders assess another outage in Norway at the Hammerfest LNG plant.
- The US Dollar index trades in the high 105.00-region, though it might face pressure from Yen interventions.

Natural Gas price (XNG/USD) trades flat at the start of the US session after Norwegian network operator Gassco confirmed that the current outage will be short lived. Earlier this Monday, Gas prices jumper on headline risk with Norway having to report an unforeseen outage. This makes it very difficult for Europe to foresee if it will get refueled ahead of the heating seasons with Gas flows into Europe being very unpredictable.
Meanwhile, the US Dollar Index (DXY), which tracks the Greenback’s value against six major currencies, is trading near its June high, where it roughly closed at the end of last week. However, there is a risk for a quick correction as the US Dollar (USD) is near the feared 160.00 level against the Japanese Yen (JPY), a level at which the Japanese government intervened in the past. The last time the government intervened, the Japanese Yen appreciated over 5% against the Greenback with a ripple effect into the DXY, which dropped nearly 2% on the back of it.
Natural Gas is trading at $2.85 per MMBtu at the time of writing.
Natural Gas news and market movers: That was quickly resolved
- Russia is going around the Arctic Sea quicker than expected, with Liquefied Natural Gas (LNG) tanker Eduard Toll passing through the Northern Sea Route. This is the quickest way for Russia to get LNG to Asia.
- Norwegian network operator Gassco reported an outage at the Hammerfest LNG Plant on Monday, according to Bloomberg. Although the outage should be solved during the day, it again shows how unreliable the current Gas flows from Norway into Europe are.
- Japan is buying into Texas shale Gas, with Mitsui & Co Limited, buying some acres to excavate for drilling. The site should be operational by 2026.
- More good news for Europe with UK's Easington terminal set to open on June 27th, a day earlier, Reuters reports.
Natural Gas Technical Analysis: Expect some sideway moves from here
Natural Gas prices have eased and might start to pick up again if the Relative Strength Index (RSI) indicator is any guide. With the price near $2.83, the RSI has cooled down after trading at elevated levels and is currently in the middle of the range around 50.00. With these constantly interrupted Gas flows from Norway into Europe, it becomes very difficult to assess whether Europe will see its Gas storage filled up in time.
The pivotal level near $3.08 (March 6, 2023, high) remains key after its false break last week. In addition, the red descending trendline in the chart below at $3.10 will also weigh on this area as a cap. Further up, the fresh year-to-date high at $3.16 is the level to beat.
On the downside, the 200-day Simple Moving Average (SMA) acts as the first support near $2.54. Should that support area fail to hold, the next target could be the pivotal level near $2.13, with interim support by the 55-day SMA near $2.51 and by the 100-day SMA at $2.21.
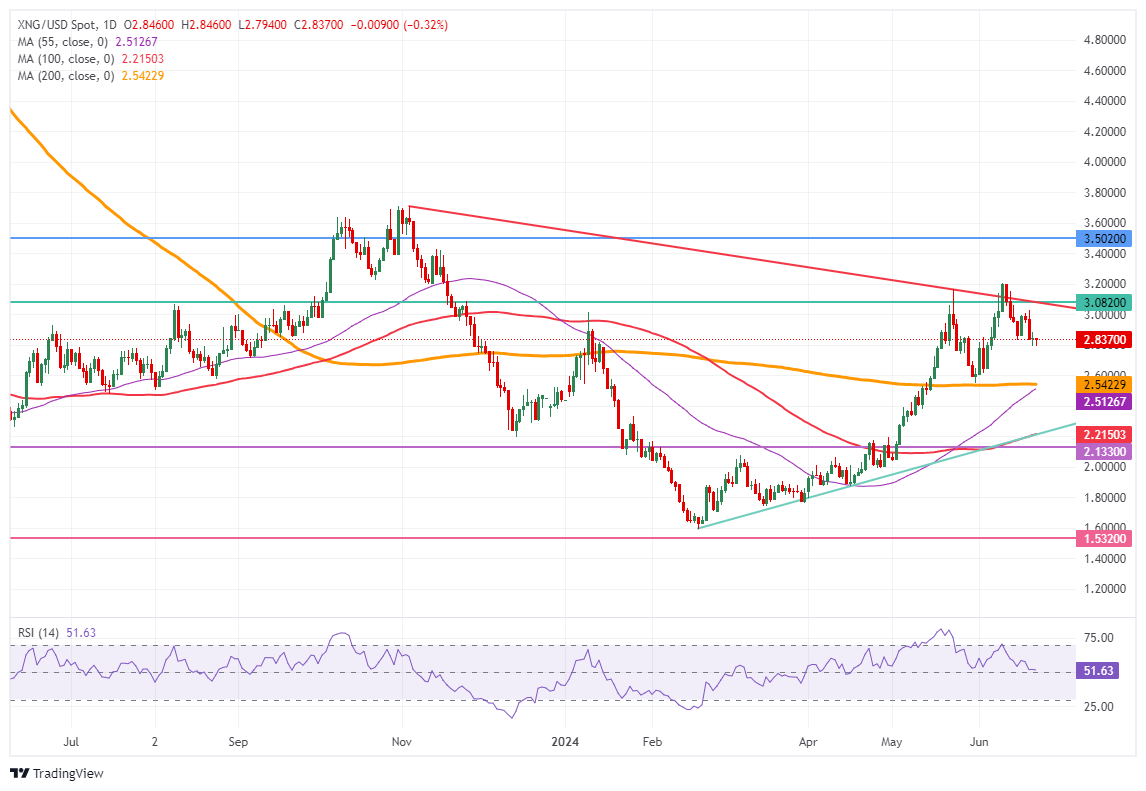
Natural Gas: Daily Chart
Natural Gas FAQs
Supply and demand dynamics are a key factor influencing Natural Gas prices, and are themselves influenced by global economic growth, industrial activity, population growth, production levels, and inventories. The weather impacts Natural Gas prices because more Gas is used during cold winters and hot summers for heating and cooling. Competition from other energy sources impacts prices as consumers may switch to cheaper sources. Geopolitical events are factors as exemplified by the war in Ukraine. Government policies relating to extraction, transportation, and environmental issues also impact prices.
The main economic release influencing Natural Gas prices is the weekly inventory bulletin from the Energy Information Administration (EIA), a US government agency that produces US gas market data. The EIA Gas bulletin usually comes out on Thursday at 14:30 GMT, a day after the EIA publishes its weekly Oil bulletin. Economic data from large consumers of Natural Gas can impact supply and demand, the largest of which include China, Germany and Japan. Natural Gas is primarily priced and traded in US Dollars, thus economic releases impacting the US Dollar are also factors.
The US Dollar is the world’s reserve currency and most commodities, including Natural Gas are priced and traded on international markets in US Dollars. As such, the value of the US Dollar is a factor in the price of Natural Gas, because if the Dollar strengthens it means less Dollars are required to buy the same volume of Gas (the price falls), and vice versa if USD strengthens.
Author

Filip Lagaart
FXStreet
Filip Lagaart is a former sales/trader with over 15 years of financial markets expertise under its belt.


