Natural Gas faces crucial moment as pivotal support gives way
- Natural Gas extends its decline and sinks to $2.55 on Monday.
- China's demand is less majestic as initially thought.
- The US Dollar index retraces after the Euro outpaced the Greenback on Monday, offering support to XNG/USD.
Natural Gas prices (XNG/USD) are extending losses and are at risk of freefalling after substantial support snapped at the start of the US trading session. The move comes on the back of China cutting its Liquified Natural Gas (LNG) imports after prices rose above $3.0 in June. It seems that the demand and hunger for LNG in China is not that big once prices are heating up, while European Gas prices are moving higher after a local temperature surge and the energy demand rose again.
Meanwhile, the US Dollar Index (DXY), which tracks the Greenback’s value against six major currencies, retraces as the Euro (which represents nearly 57.6% of the Index) outpaces the Greenback after the French government elections held on Sunday, with a win for the far right not being that convincing and still all possible outcomes on the table ahead of the second round vote on July 7. Traders are also gearing up for a crammed US economic calendar, with the US Jobs Report on Friday as the cherry on the cake.
Natural Gas is trading at $2.52 per MMBtu at the time of writing.
Natural Gas news and market movers: Dipping further
- Europe's gas prices are sinking as well with current supply numbers being large and broad enough to whistand current demand as heat waves are roaming through Europe and are sparking demand for energy to fuel airconditionings.
- Bloomberg reports that China’s LNG imports fell for the first time in more than a year, by 6.2% compared to the same month last year.
- Germany is topping over 80% of its Ggas storage capacity by hitting 81%. The overall EU gas storage capacity is at 77%, according to Gas Infrastructure Europe (GIE).
Natural Gas Technical Analysis: RSI forecasts pain trade not over yet
Natural Gas price is hitting solid ground with a double layer of support coming from the 100-day Simple Moving Average (SMA) and the 200-day SMA. The steep decline in the price comes with the main buyer, China, having eased its recent Gas imports for June after Gas prices rallied the month before. Add the steady Gas import flow in Europe, with Germany already at 81% in reserves ahead of winter, and it could be that this direction has not yet reached the end of the line.
The pivotal level near $3.08 (March 6, 2023, high) remains key resistance after its false break last week, which is still 20% away. In addition, the red descending trendline in the chart below at $3.10 will also weigh on this area as a cap. Further up, the fresh year-to-date high at $3.16 is the level to beat.
On the downside, the 200-day Simple Moving Average (SMA) acts as the first support near $2.54. Should that support area fail to hold, the next target could be the pivotal level near $2.13, with interim support by the 55-day SMA near $2.58 and by the 100-day SMA at $2.25.
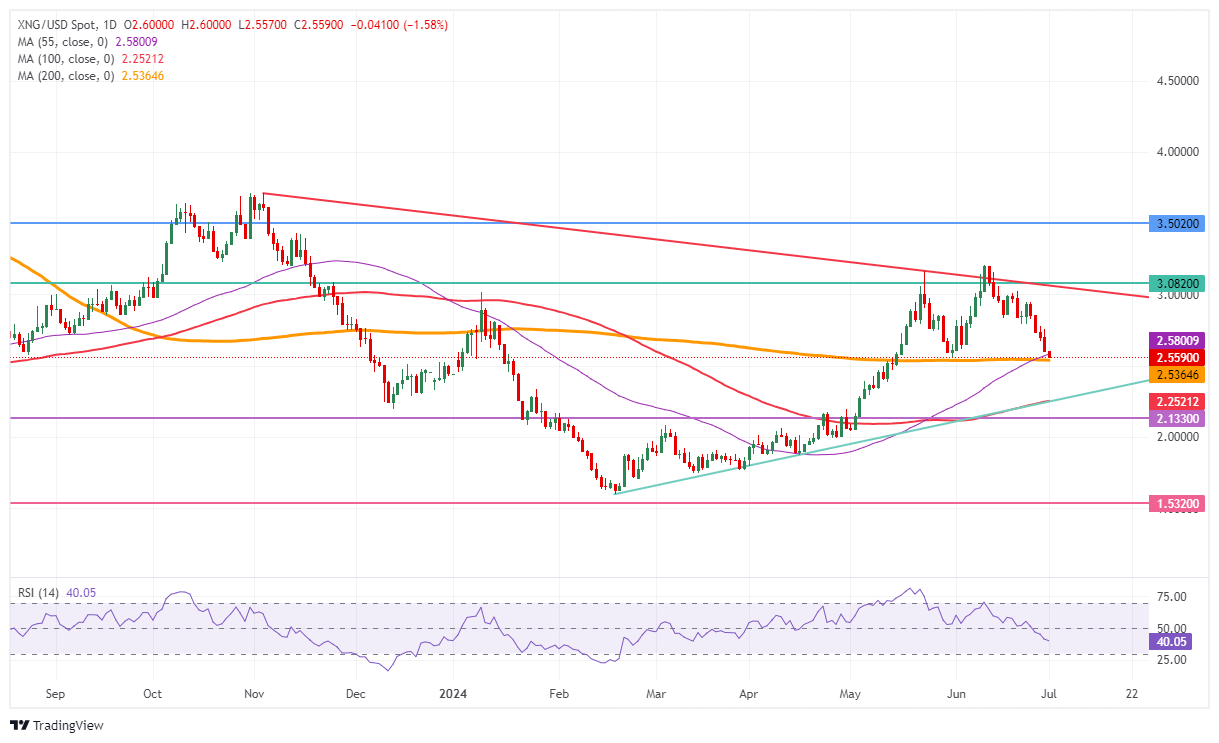
Natural Gas: Daily Chart
Natural Gas FAQs
Supply and demand dynamics are a key factor influencing Natural Gas prices, and are themselves influenced by global economic growth, industrial activity, population growth, production levels, and inventories. The weather impacts Natural Gas prices because more Gas is used during cold winters and hot summers for heating and cooling. Competition from other energy sources impacts prices as consumers may switch to cheaper sources. Geopolitical events are factors as exemplified by the war in Ukraine. Government policies relating to extraction, transportation, and environmental issues also impact prices.
The main economic release influencing Natural Gas prices is the weekly inventory bulletin from the Energy Information Administration (EIA), a US government agency that produces US gas market data. The EIA Gas bulletin usually comes out on Thursday at 14:30 GMT, a day after the EIA publishes its weekly Oil bulletin. Economic data from large consumers of Natural Gas can impact supply and demand, the largest of which include China, Germany and Japan. Natural Gas is primarily priced and traded in US Dollars, thus economic releases impacting the US Dollar are also factors.
The US Dollar is the world’s reserve currency and most commodities, including Natural Gas are priced and traded on international markets in US Dollars. As such, the value of the US Dollar is a factor in the price of Natural Gas, because if the Dollar strengthens it means less Dollars are required to buy the same volume of Gas (the price falls), and vice versa if USD strengthens.
Author

Filip Lagaart
FXStreet
Filip Lagaart is a former sales/trader with over 15 years of financial markets expertise under its belt.


