Natural Gas contains intraday losses though unable to avoid seventh day in red
- Natural Gas sets forth its losing streak for a seventh day.
- European gas storages are filling up quickly, even with demand picking up.
- The US Dollar index eases ahead of a very full agenda due to Thursday’s public holiday.

Natural Gas price (XNG/USD) is still stuck in its downward correction on Wednesday, adding a seventh day of declines to the chronicles. The decline is being fueled again by the outlook that European Gas storages are still being filled up despite the current pickup in energy demand. Europe looks set to head into the next heating season with ample supply to winter through.
Meanwhile, the US Dollar Index (DXY), which tracks the Greenback’s value against six major currencies, eases after US Federal Reserve Bank of Chicago President Austan Goolsbee advocated for rate cuts during an interview with Bloomberg during the European Central Bank symposium in Sintra, Portugal, on Tuesday. The change comes after several weeks of US Federal Reserve (Fed) officials’ comments signaling the same message: that rates should be kept steady for longer.
Natural Gas is trading at $2.44 per MMBtu at the time of writing.
Natural Gas news and market movers: European storages outperforming
- Norwegian Gas operator GASSCO is showing that gas flows from Norway into Europe are above their 5-day average volume, according to Bloomberg.
- Northwestern Europe will see high temperatures returning by the weekend, which means energy consumption will increase.
- Reuters reports that the French energy company TotalEnergies has notified South Africa's petroleum regulator of its plans to exit its offshore gas field but has yet to submit a formal request to do so, a source at Petroleum Agency SA said.
- Investments funds are piling in again on European gas futures, with bullish bets on any supply disruptions that would create an imbalance in the European market, Bloomberg reports.
Natural Gas Technical Analysis: Still some room to go
Natural Gas price has snapped the important 200-day Simple Moving Average (SMA) support near $2.53 and is ekeing out more losses. With that break lower, Gas price is now trading below $2.50. A very wide area is opening up now where gas prices could still sink around 8% lower, before the Relative Strength Index (RSI) reaches the oversold barrier.
The 200-day SMA turns now as a resistance, near $2.53. Once back above there, the pivotal level near $3.08 (March 6, 2023, high) remains key resistance after its false break last week, which is still 20% away. In addition, the red descending trendline in the chart below at $3.10 will also weigh on this area as a cap. Further up, the fresh year-to-date high at $3.16 is the level to beat.
On the downside, the next target could be the pivotal level near $2.13, with interim support by the 100-day SMA near $2.25
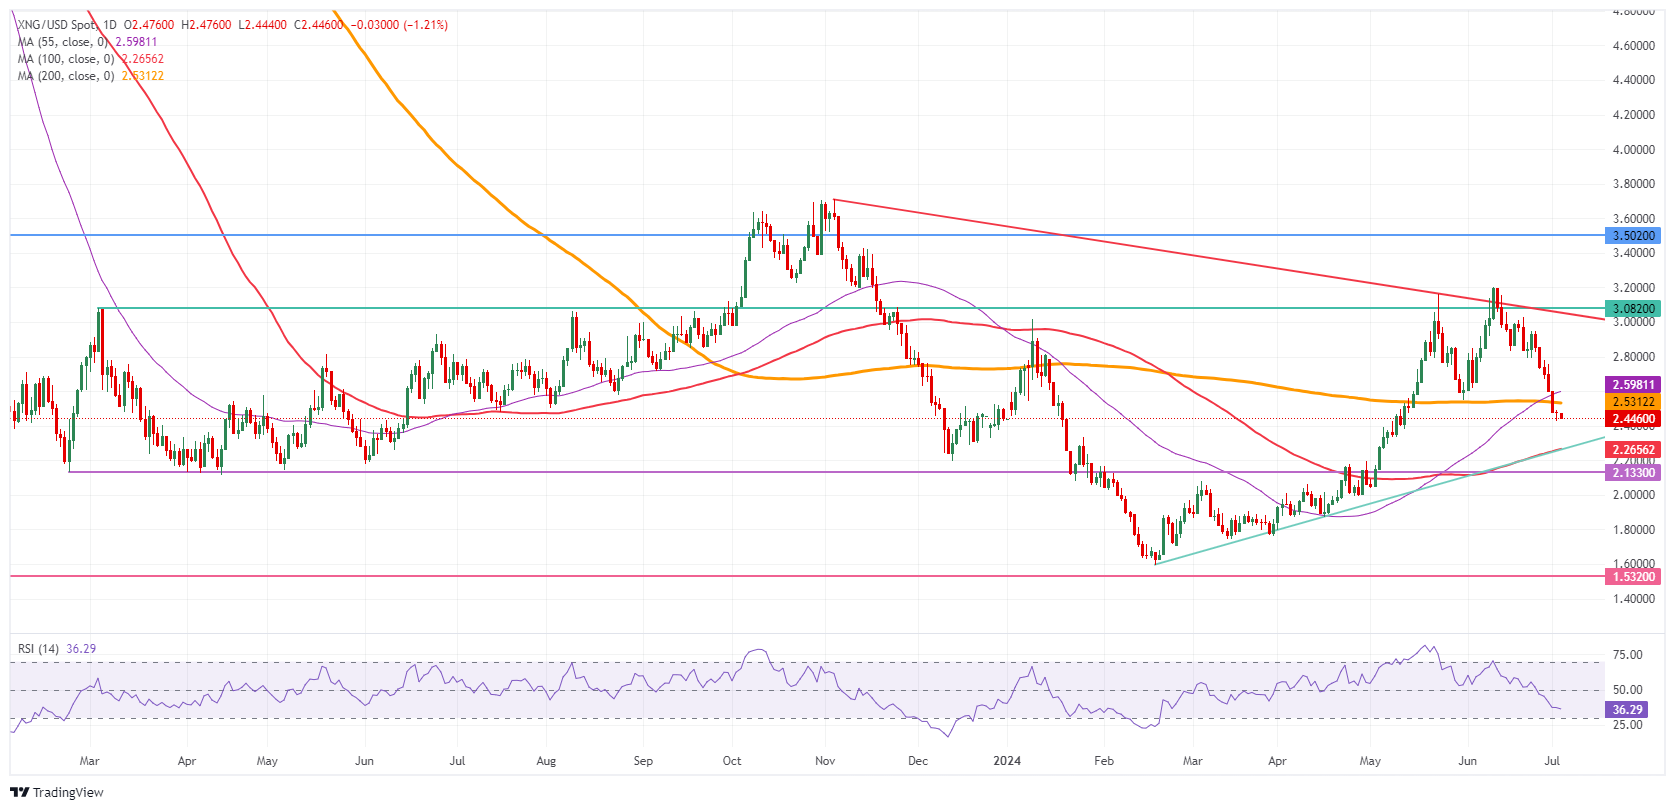
Natural Gas: Daily Chart
Natural Gas FAQs
Supply and demand dynamics are a key factor influencing Natural Gas prices, and are themselves influenced by global economic growth, industrial activity, population growth, production levels, and inventories. The weather impacts Natural Gas prices because more Gas is used during cold winters and hot summers for heating and cooling. Competition from other energy sources impacts prices as consumers may switch to cheaper sources. Geopolitical events are factors as exemplified by the war in Ukraine. Government policies relating to extraction, transportation, and environmental issues also impact prices.
The main economic release influencing Natural Gas prices is the weekly inventory bulletin from the Energy Information Administration (EIA), a US government agency that produces US gas market data. The EIA Gas bulletin usually comes out on Thursday at 14:30 GMT, a day after the EIA publishes its weekly Oil bulletin. Economic data from large consumers of Natural Gas can impact supply and demand, the largest of which include China, Germany and Japan. Natural Gas is primarily priced and traded in US Dollars, thus economic releases impacting the US Dollar are also factors.
The US Dollar is the world’s reserve currency and most commodities, including Natural Gas are priced and traded on international markets in US Dollars. As such, the value of the US Dollar is a factor in the price of Natural Gas, because if the Dollar strengthens it means less Dollars are required to buy the same volume of Gas (the price falls), and vice versa if USD strengthens.
Author

Filip Lagaart
FXStreet
Filip Lagaart is a former sales/trader with over 15 years of financial markets expertise under its belt.


