Natural Gas price rebounds strongly on weaker US Dollar after inflation data miss
- Natural Gas price recovers following the release of US inflation data which comes out lower than expected, weighing on the US Dollar.
- Natural Gas had been trading flat-to-lower prior to the data on Friday due to greater-than-expected stockpiles in Europe.
- This largely eclipsed US data out on Thursday showing a fall in inventories last week.

Natural Gas price recovers on Friday after the release of US inflation data shows an unexpected fall in prices which weighs on the US Dollar. The lower inflation data reduces the chances of the Federal Reserve (Fed) hiking interest rates at its next meeting which is negative for USD. Natural Gas, which is mainly priced and traded in US Dollars, rose on the news.
The commodity had been trading slightly lower prior to the release on the back of easing supply concerns, after data from S&P Global showed European stockpiles at 77% capacity, reassuring traders that storage tanks will be full in time for the winter demand glut. This undid the gains made on Thursday after US data showed a surprise fall in inventories last week.
XNG/USD is trading in the $2.700s/MMBtu during the US session.
Natural Gas news and market movers
-
The Fed's prefered guage of inflation, the Core Personal Consumption Expenditure Price Index undershoots expectations in May, coming out at 0.3% month-on-month, instead of 0.4% forecast. Year-on-year it shows a 4.6% result versus the 4.7% expected, according to data from the Bureau of Economic Analysis.
-
The result reduces the likelihood of the Fed hiking interest rates at the next meeting in July. This weakens the US Dollar since higher interest rates tend to attract greater inflows of foriegn capital. The weaker USD has the effect of raising Natural Gas prices which are priced in USD.
-
European storage levels of Natural Gas – built up in preparation for the winter – are substantially higher than in previous years, easing supply concerns and putting a lid on prices.
-
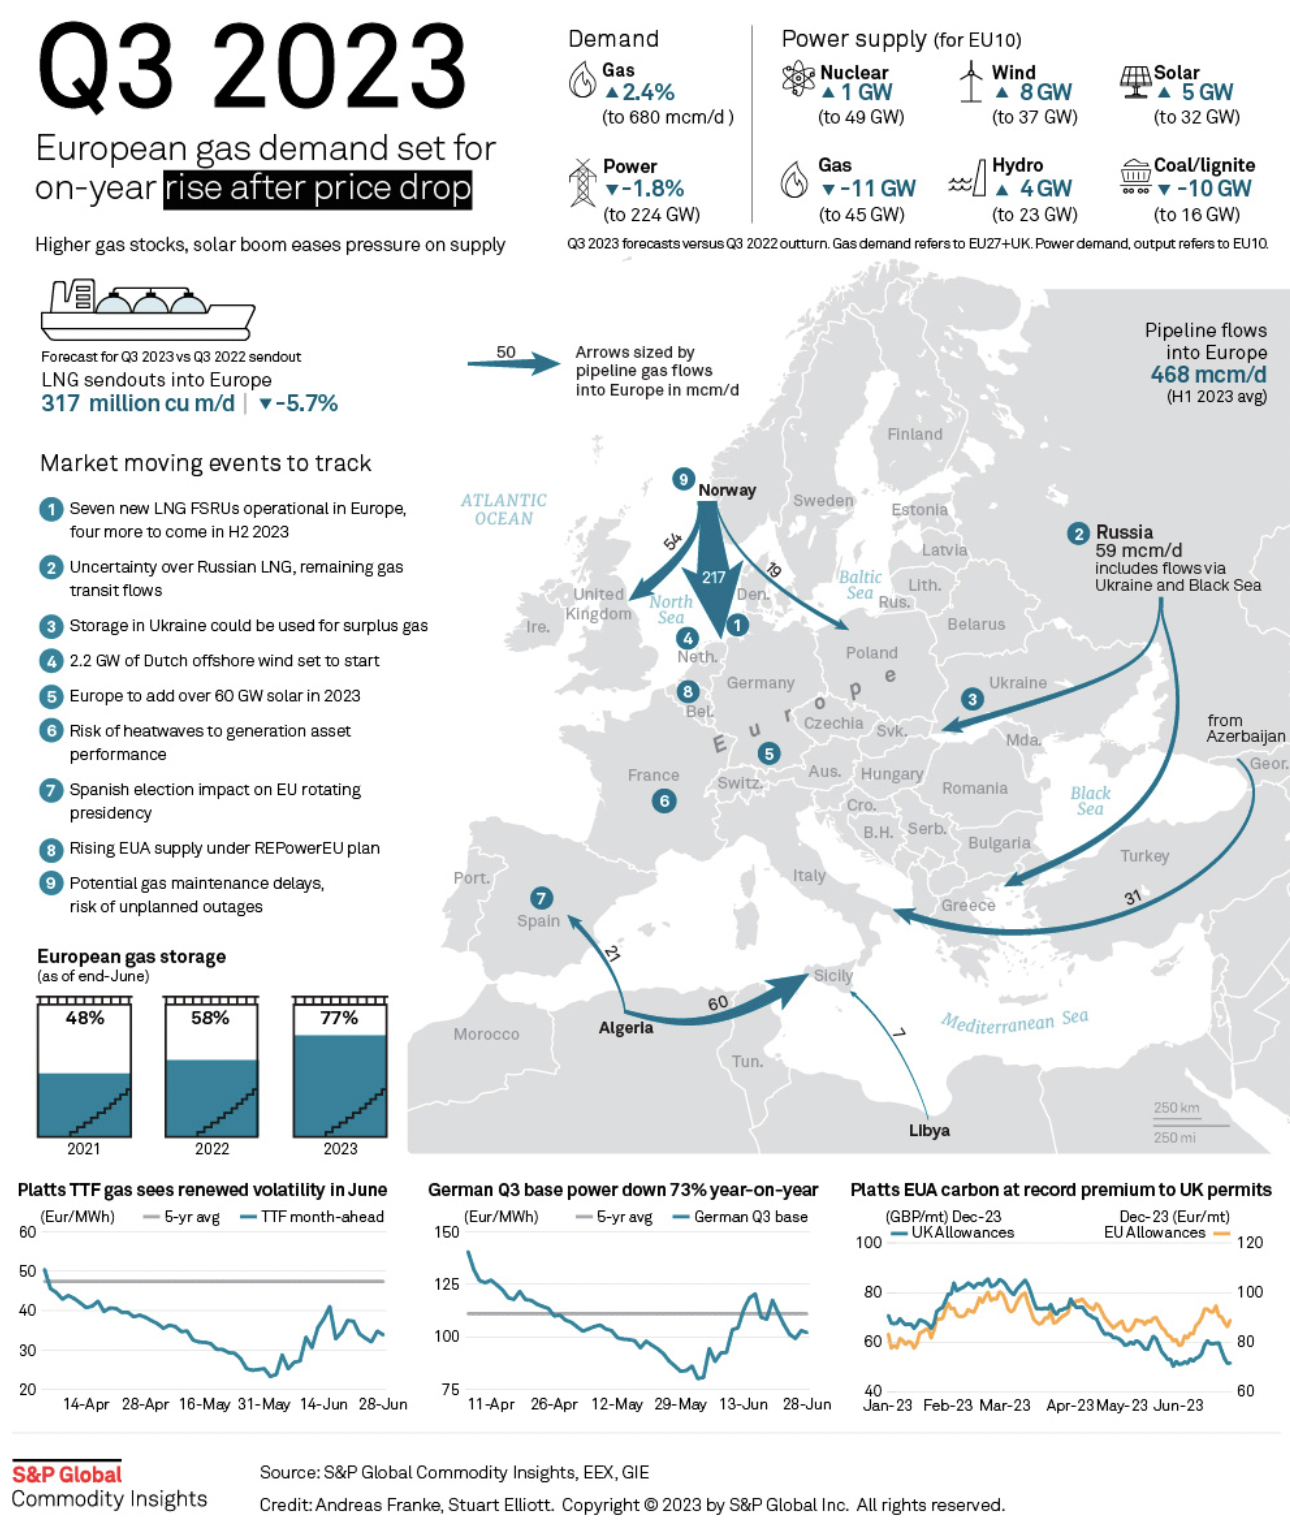
Natural Gas storage capacity in Europe has reached 77%, according to the latest data from S&P Global, which compares to 58% in 2022 for the same time of year and 48% in 2021.
-
S&P Global’s article suggests demand may still rise in Q3 (2023), however, because of low prices.
-
Its infographic for Q3 (see below) forecasts an increase of 2.4% in Natural Gas demand in the quarter to 680 million cubic meters of Gas per day (mcm/d).
-
S&P Global says that the higher Natural Gas stocks and boom in solar energy will “ease pressure on supply”.
-
The current relatively low Natural Gas prices are themselves a result of an overall lower level of demand so far in 2023, according to Irina Slav, a reporter for Oilprice.com.
-
Reduced consumption has become the norm in Europe after energy bills skyrocketed in 2022, and pressure from some governments to lower consumption have combined to force consumers to be more prudent, says Slav.
-
The 2022-2023 winter was also relatively mild in both the US and Europe, reducing demand for Natural Gas and leaving stockpiles high from last year. This means less is required to top them up in 2023, Slav writes.
-
“The reason for the lower prices is, as could be expected, lower demand. It is true that Europe is buying liquefied natural gas. But it is buying a lot less than last year: because its storage caverns are not infinite, and there is still quite a lot of gas left in them from last year,” reports Slav on Friday.
-
Natural Gas has also fallen after the return of geopolitical stability to Russia, which is still a major producer. When the Wagner mutiny began, prices rose on fears supply would be disrupted by a civil war. However, now that the mutiny is over, they have fallen back.
-
Norwegian supply concerns, after outages at the Hammerfest LNG export terminal and the processing plants at Nyhamna and Kollsnes, continue to underpin prices. However, the high storage levels witnessed in Europe mean that the outages in Norway are now less of a concern.
-
Volatility from traders shuffling positions ahead of the expiration date for front-month Futures and Options contracts might be impacting prices as the month of June comes to an end, according to Natural Gas Intelligence (NGI).
-
Moving to the US, the Natural Gas price gapped higher on Thursday after EIA data showed a lower-than-forecast change in US Storage data in the week ending June 23.
-
The sudden recovery came after an almost 10% decline in price from the June highs.
-
Demand for Natural Gas to power air conditioning may be about to moderate following reports that temperatures in the US are set to return to average ranges for this time of year next week.
Natural Gas: S&P Global Infographic
Natural Gas Technical Analysis: Recovery stalls near significant trend-determination level
Natural Gas price is trading just below a key trend-determination level on longer-term charts. Although the commodity remains in a long-term downtrend since turning lower at the August 2022 peak, bearish momentum has tapered off considerably.
The Relative Strength Index (RSI) momentum indicator is converging bullishly with price on the weekly chart, something that occurs when price makes new lows but RSI does not.
A break above the last lower high of the long-term downtrend at $3.079 MMBtu would indicate a reversal in the broader downtrend.
-638237258617255695.png)
Natural Gas: Weekly Chart
Given this level has not been breached yet, however, the downtrend remains intact, and a break below the $2.110 year-to-date lows would provide a confirmation of a continuation down to a target at $1.546. This target is the 61.8% Fibonacci extension of the height of the roughly sideways consolidation range that has been unfolding during 2023 (marked 161.8% on charts).
On the daily chart, price has been climbing within a roughly sideways market, although it has broken above both the 50 and the 100-day Simple Moving Averages (SMA).
-638237259147690923.png)
Natural Gas: Daily Chart
Nevertheless, a break above the last lower high of the long-term downtrend at $3.079 MMBtu would be required to indicate a reversal in the broader trend.
Such a move might then see prices rally higher to the next key resistance level at the 200-week SMA, situated at $3.813.
Until that happens, however, price will probably continue to consolidate within its range.
Natural Gas FAQs
What fundamental factors drive the price of Natural Gas?
Supply and demand dynamics are a key factor influencing Natural Gas prices, and are themselves influenced by global economic growth, industrial activity, population growth, production levels, and inventories. The weather impacts Natural Gas prices because more Gas is used during cold winters and hot summers for heating and cooling. Competition from other energy sources impacts prices as consumers may switch to cheaper sources. Geopolitical events are factors as exemplified by the war in Ukraine. Government policies relating to extraction, transportation, and environmental issues also impact prices.
What are the main macroeconomic releases that impact on Natural Gas Prices?
The main economic release influencing Natural Gas prices is the weekly inventory bulletin from the Energy Information Administration (EIA), a US government agency that produces US gas market data. The EIA Gas bulletin usually comes out on Thursday at 14:30 GMT, a day after the EIA publishes its weekly Oil bulletin. Economic data from large consumers of Natural Gas can impact supply and demand, the largest of which include China, Germany and Japan. Natural Gas is primarily priced and traded in US Dollars, thus economic releases impacting the US Dollar are also factors.
How does the US Dollar influence Natural Gas prices?
The US Dollar is the world’s reserve currency and most commodities, including Natural Gas are priced and traded on international markets in US Dollars. As such, the value of the US Dollar is a factor in the price of Natural Gas, because if the Dollar strengthens it means less Dollars are required to buy the same volume of Gas (the price falls), and vice versa if USD strengthens.
Author

Joaquin Monfort
FXStreet
Joaquin Monfort is a financial writer and analyst with over 10 years experience writing about financial markets and alt data. He holds a degree in Anthropology from London University and a Diploma in Technical analysis.


