Natural Gas nosedives in US session on Wednesday
- Natural Gas in its eighth day of consecutive losses.
- Traders are sending Gas prices already 20% lower since the start of February.
- The US Dollar Index roared on the back of red-hot inflation, consolidating gains this Wednesday.

Natural Gas (XNG/USD) is eking out more losses with February being outright negative for the fossil fuel. The additional move this time comes with Shell issuing an outlook where Liquefied Natural Gas (LNG) demand will be substantially decreased by 2040, seeing the current pushes worldwide to abandon fossil fuels. The outlook supports the overall trend seen in both Oil and Gas with several administrations worldwide taking measures to further limit and phase out usage on all fronts.
The US Dollar (USD) is trying to consolidate its current position after it booked some substantial gains on the back of a red-hot US inflation report that pointed to sticky price pressures being present. Markets had to push back further their expectations of an initial rate cut by the US Federal Reserve (Fed) from June into July. This made equities nosedive, though those are recovering at the moment ahead of the US opening bell.
Natural Gas is trading at $1.68 per MMBtu at the time of writing.
Natural Gas market movers: Gas prices low enough for power production
- Shell said in its outlook that demand for LNG by 2040 will be lower than first anticipated.
- Some tightening in European gas prices is showing that traders are focussing on the restocking of European gas storage ahead of next winter.
- Europe will need to look for 5% more LNG supply in order to reach the same levels of gas storage seen in 2023 ahead of winter.
- The warm front is closing in as expected and would see temperatures rise to unseasonable levels with London projected to reach 13 degrees Celsius.
- Current price levels are making Gas cheap enough again to use for power production.
Natural Gas Technical Analysis: Gas below $2?
Natural Gas is unable to halt the current downturn which has been going on for eight straight days already. More downturn looks to be at hand with supply still very much flowing and demand remaining rather tepid. Add several more calls for the longer term outlook where LNG and other fossil fuels are being phased out, and a quick return to higher levels looks not to be in the cards anytime soon.
On the upside, Natural Gas is facing some pivotal technical levels to get back to. First, $1.99, which saw an accelerated decline. Next is the blue line at $2.13 with the triple bottoms from 2023. In case Natural Gas sees sudden demand pick up, possibly $2.40 could come into play.
Keep an eye on $1.80, which was a pivotal level back in July 2020 and should act as a cap now. Should US President Biden’s moratorium be lifted, together with the additional supply from Canada – which is exporting more to fill the gap from the US – $1.64 and $1.53 (low of 2020) are targets to look out for.
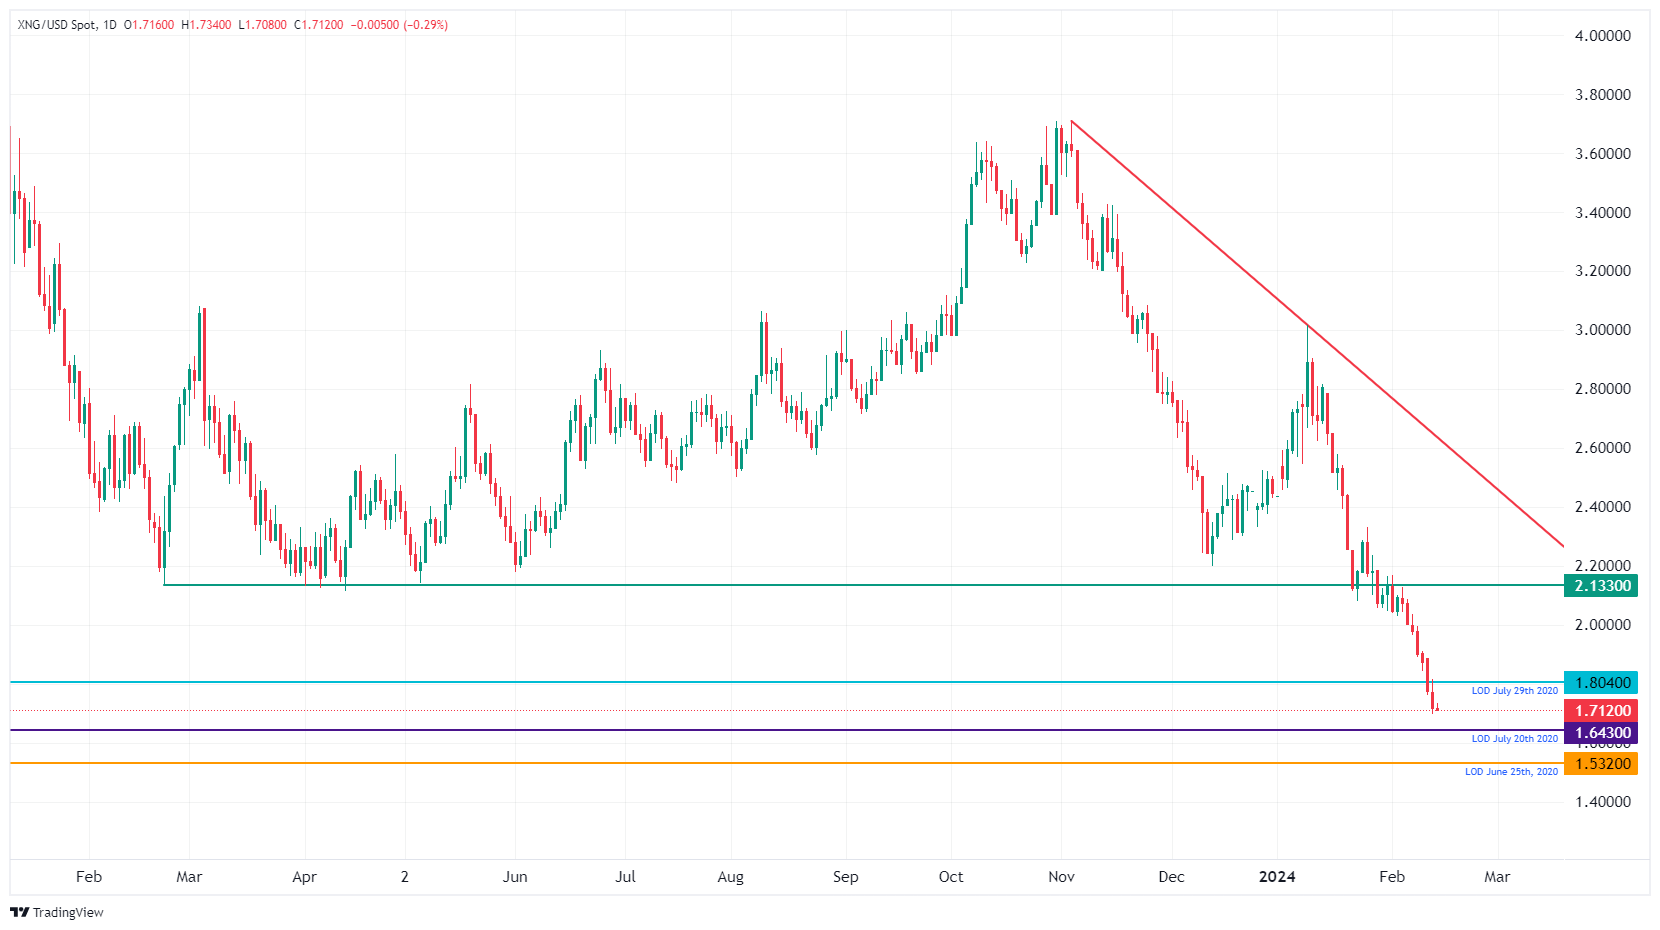
XNG/USD (Daily Chart)
Natural Gas FAQs
What fundamental factors drive the price of Natural Gas?
Supply and demand dynamics are a key factor influencing Natural Gas prices, and are themselves influenced by global economic growth, industrial activity, population growth, production levels, and inventories. The weather impacts Natural Gas prices because more Gas is used during cold winters and hot summers for heating and cooling. Competition from other energy sources impacts prices as consumers may switch to cheaper sources. Geopolitical events are factors as exemplified by the war in Ukraine. Government policies relating to extraction, transportation, and environmental issues also impact prices.
What are the main macroeconomic releases that impact on Natural Gas Prices?
The main economic release influencing Natural Gas prices is the weekly inventory bulletin from the Energy Information Administration (EIA), a US government agency that produces US gas market data. The EIA Gas bulletin usually comes out on Thursday at 14:30 GMT, a day after the EIA publishes its weekly Oil bulletin. Economic data from large consumers of Natural Gas can impact supply and demand, the largest of which include China, Germany and Japan. Natural Gas is primarily priced and traded in US Dollars, thus economic releases impacting the US Dollar are also factors.
How does the US Dollar influence Natural Gas prices?
The US Dollar is the world’s reserve currency and most commodities, including Natural Gas are priced and traded on international markets in US Dollars. As such, the value of the US Dollar is a factor in the price of Natural Gas, because if the Dollar strengthens it means less Dollars are required to buy the same volume of Gas (the price falls), and vice versa if USD strengthens.
Author

Filip Lagaart
FXStreet
Filip Lagaart is a former sales/trader with over 15 years of financial markets expertise under its belt.