Natural Gas sinks with supply increases taking wind out of rate cut expectations
- Natural Gas dips again on Thursday, testing vital support before a steep decline.
- Traders see demand slumping with inventories growing quick.
- The US Dollar index falls to 104.00 in a very soft CPI print.

Natural Gas price (XNG/USD) falls near 1% on Thursday despite help from a very soft US Consumer Price Index (CPI) print on all fronts. That support is being matched and fazed out by the swelling storages, despite the local demand. European countries like Spain, Italy and Portugal are seeing a jump in energy demand to fuel airconditioning units, while European storages are filling up at a faster pace, even with elevated demand in the soutern countries.
Meanwhile, the US Dollar Index (DXY), which tracks the Greenback’s value against six major currencies, sinks in the CPI aftermath. The fact that the Headline monthly CPI number for June contracted by 0.1%, is being seen as a pickup in disinflationary forces. Certainly retail sales is declining rapidly, which points to US consumer being more willing to wait for lower prices before buying the goods, instead of purchasing at any cost.
Natural Gas is trading at $2.30 per MMBtu at the time of writing.
Natural Gas news and market movers: CPI did not help
- The Karsto plant in Norway faces maintenance until July 13 following another extension earlier, according to network operator Gassco AS, Bloomberg reports.
- Woodside Energy in Australia has signed a deal with Taiwan for LONG deliveries, Reuters reports.
- The gas premium spread in Europe is widening between the southern peripheral countries and mainland Europe. Elevated temperatures across Spain, Portugal, and Italy are triggering a short-term tightness with elevated demand over steady supply, Bloomberg reports.
- The Energy Information Administration (EIA) will release its weekly Natural Gas Storage number for July 5th. Previous build was at 32 billion, with 56 billion forecasted.
Natural Gas Technical Analysis: Watch out for the break lower
Natural Gas price stabilizes near the crucial support area at $2.30 ahead of June’s US CPI release. It becomes clear that commodity traders seek an outside catalyst to move price action in either direction. Should the CPI release be binary, expect to see a substantial move either way in Gas price on the back of the CPI outcome confirming or denying a September rate cut.
The 200-day SMA is the first force to reckon with on the upside, near $2.51, closely followed by the 55-day SMA at $2.63. Once back above, the pivotal level near $3.08 (March 6, 2023, high) remains key resistance after its false break last week.
On the downside, the support level, which could mean some buying opportunities, is $2.30, the 100-day SMA that falls in line with the ascending trend line since mid-February. In case that level does not hold as support, look for the pivotal level near $2.13, which has acted as a cap and floor in the past.
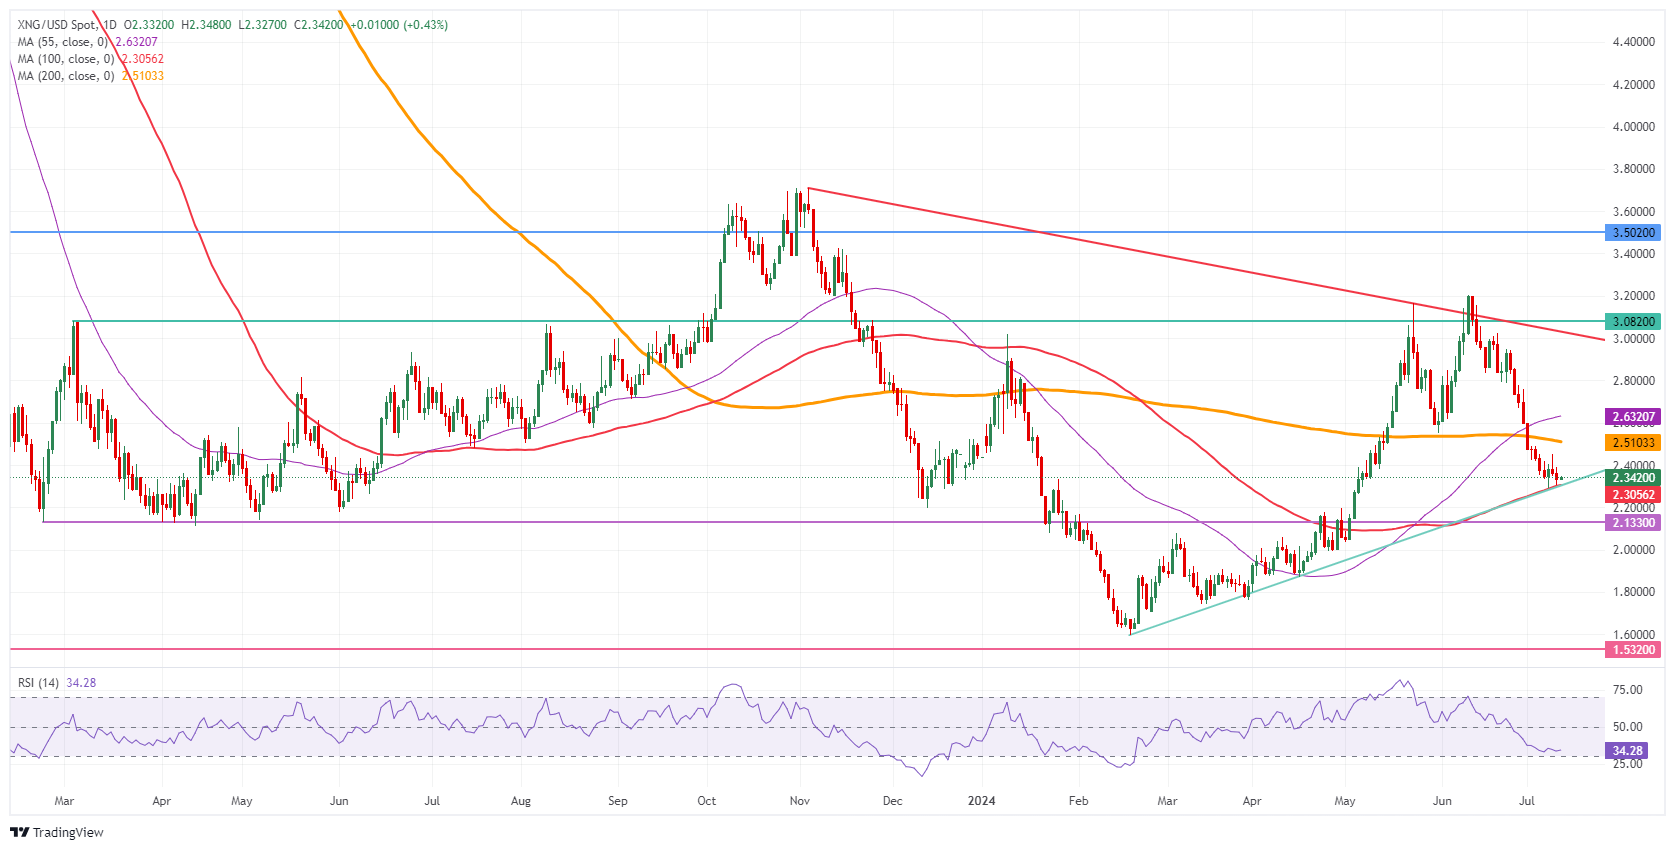
Natural Gas: Daily Chart
Natural Gas FAQs
Supply and demand dynamics are a key factor influencing Natural Gas prices, and are themselves influenced by global economic growth, industrial activity, population growth, production levels, and inventories. The weather impacts Natural Gas prices because more Gas is used during cold winters and hot summers for heating and cooling. Competition from other energy sources impacts prices as consumers may switch to cheaper sources. Geopolitical events are factors as exemplified by the war in Ukraine. Government policies relating to extraction, transportation, and environmental issues also impact prices.
The main economic release influencing Natural Gas prices is the weekly inventory bulletin from the Energy Information Administration (EIA), a US government agency that produces US gas market data. The EIA Gas bulletin usually comes out on Thursday at 14:30 GMT, a day after the EIA publishes its weekly Oil bulletin. Economic data from large consumers of Natural Gas can impact supply and demand, the largest of which include China, Germany and Japan. Natural Gas is primarily priced and traded in US Dollars, thus economic releases impacting the US Dollar are also factors.
The US Dollar is the world’s reserve currency and most commodities, including Natural Gas are priced and traded on international markets in US Dollars. As such, the value of the US Dollar is a factor in the price of Natural Gas, because if the Dollar strengthens it means less Dollars are required to buy the same volume of Gas (the price falls), and vice versa if USD strengthens.
Author

Filip Lagaart
FXStreet
Filip Lagaart is a former sales/trader with over 15 years of financial markets expertise under its belt.


