Natural Gas sees small turnaround with NFP turning mixed
- Natural Gas jumps higher in the US session on Friday.
- Gas traders are sending prices lower, with Netanyahu open for a diplomatic solution.
- The US Dollar index eases as well, with pressure building ahead of the Nonfarm Payrolls release.

Natural Gas price (XNG/USD) is trading in the green, even up over 1% on the day, after US Nonfarm Payrolls number shows some positive elements that the US Federal Reserve might be cutting in September. More positive headlines as well from Israel where Reuters reported that Israeli Prime Minister Benjamin Netanyahu assembled a diplomatic task force that will enter into negotiations with Hamas for a ceasefire and hostage deal. Although Netanyahu quickly saw that a ceasefire deal did not mean the war had stopped, markets focused on the fact that talks were underway.
Meanwhile, the US Dollar Index (DXY), which tracks the Greenback’s value against six major currencies, eases as well on Friday, for a fourth straight day in a row this week. Traders are seeing the Greenback as fairly valued below 105.00 after the US Nonfarm Payrolls report. Although the number came in above consensus, the unemployment rate ticked up and several other components are starting to ease.
Natural Gas is trading at $2.40 per MMBtu at the time of writing.
Natural Gas news and market movers: Careful for the dip
- Bloomberg published a piece on Friday stating that private Gas companies in China sell Liquefied Natural Gas (LNG) import slots in new terminal facilities publicly in the open market. This means several slots are up for grabs, with importers not needing them as demand for LNG is cooling down quit rapidly.
- Takeover rumors in the LNG industry as Abu Dhabi National Oil Company (ADNOC) is considering a possible bid for Australian gas supplier Santos, according to Reuters.
- With the decline in European gas prices, volatility is declining as well, which put options traders on the bench. No significant volumes are being taken in on options betting on sudden surges or spikes in Natural Gas prices.
- The Baker Hughes US Oil Rig Count is due this evening near 17:00 GMT. The previous number was a count of 479 rigs.
Natural Gas Technical Analysis: Wait and see
Natural Gas price might be looking interesting to dive into for some buying-the-dip, though that would, for now, only be for the venturous traders. The Relative Strength Index (RSI) is still not trading at or below the ‘oversold’ barrier and thus has more room to go. Traders will wait for the right moment to buy the dip, which could see Natural Gas prices bounce back up to $2.52 initially.
The 200-day Simple Moving Average (SMA) is the first force to reckon with on the upside, near $2.52, closely followed by the 55-day SMA at $2.61. Once back above, the pivotal level near $3.08 (March 6, 2023, high) remains key resistance after its false break last week, which is still 20% away.
The support level, which could mean some buying opportunities, is $2.28, the 100-day SMA that falls in line with the ascending trend line since mid-February. In case that level does not hold as support, look for the pivotal level near $2.13, which acted as a cap and floor in the past.
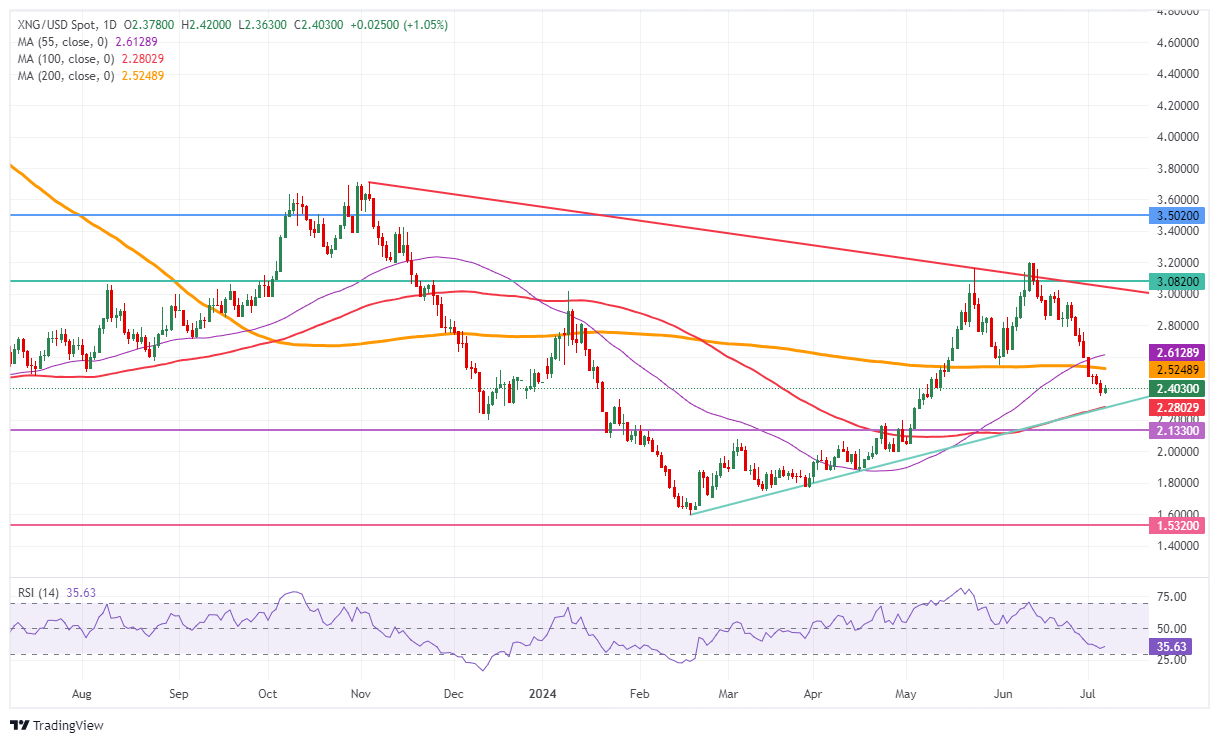
Natural Gas: Daily Chart
Natural Gas FAQs
Supply and demand dynamics are a key factor influencing Natural Gas prices, and are themselves influenced by global economic growth, industrial activity, population growth, production levels, and inventories. The weather impacts Natural Gas prices because more Gas is used during cold winters and hot summers for heating and cooling. Competition from other energy sources impacts prices as consumers may switch to cheaper sources. Geopolitical events are factors as exemplified by the war in Ukraine. Government policies relating to extraction, transportation, and environmental issues also impact prices.
The main economic release influencing Natural Gas prices is the weekly inventory bulletin from the Energy Information Administration (EIA), a US government agency that produces US gas market data. The EIA Gas bulletin usually comes out on Thursday at 14:30 GMT, a day after the EIA publishes its weekly Oil bulletin. Economic data from large consumers of Natural Gas can impact supply and demand, the largest of which include China, Germany and Japan. Natural Gas is primarily priced and traded in US Dollars, thus economic releases impacting the US Dollar are also factors.
The US Dollar is the world’s reserve currency and most commodities, including Natural Gas are priced and traded on international markets in US Dollars. As such, the value of the US Dollar is a factor in the price of Natural Gas, because if the Dollar strengthens it means less Dollars are required to buy the same volume of Gas (the price falls), and vice versa if USD strengthens.
Author

Filip Lagaart
FXStreet
Filip Lagaart is a former sales/trader with over 15 years of financial markets expertise under its belt.


