Nasdaq (NDX) (QQQ) Key Technical Levels: CPI pops but not enough for stocks to drop
- The Nasdaq remains poised for further record highs but shied away on Wednesday.
- US indices wobbled on CPI release but bounce from lows.
- Nasdaq double bottom and volume profile suggest strong support.

A slightly higher than expected US CPI report wobbled the indices initially before the realization spread that the number was not actually that unexpected. The inflation genie has been out of the bottle for some time now, and markets have powered on regardless. It will take a truly shocking increase to dent investor enthusiasm.
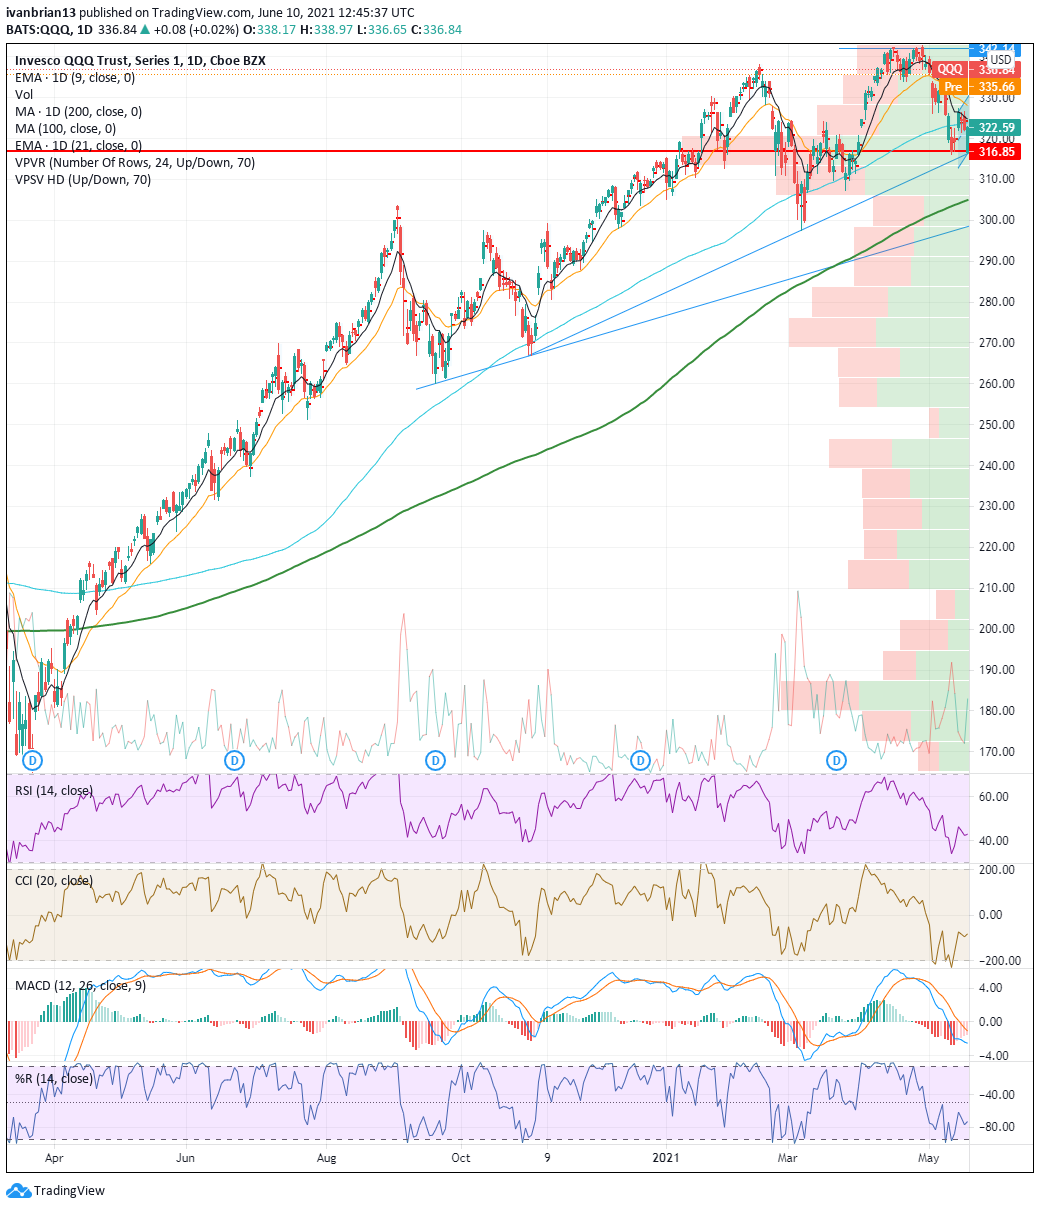
Nasdaq (QQQ) forecast
The double bottom from May 12 and 19 really was a perfect signal, accompanied as it was by the point of control being exactly at those lows at the time. The point of control is a measure of volume and price activity. It is very similar to the market profile for those that are familiar with that. For those that are not, the premise of both is the same: identify fair value areas. These areas where there has been the most volume are generally the strongest areas of price discovery and hence support or resistance. Markets move, looking for areas of stability or so-called fair value. Markets move quickly through unfair areas and stabilize at fair areas. Volume profile shows those price levels that have the highest volume and, therefore, the highest importance. The point of control in a given range or time period is the fairest price over that time horizon. Of course it moves based on the time horizon used.
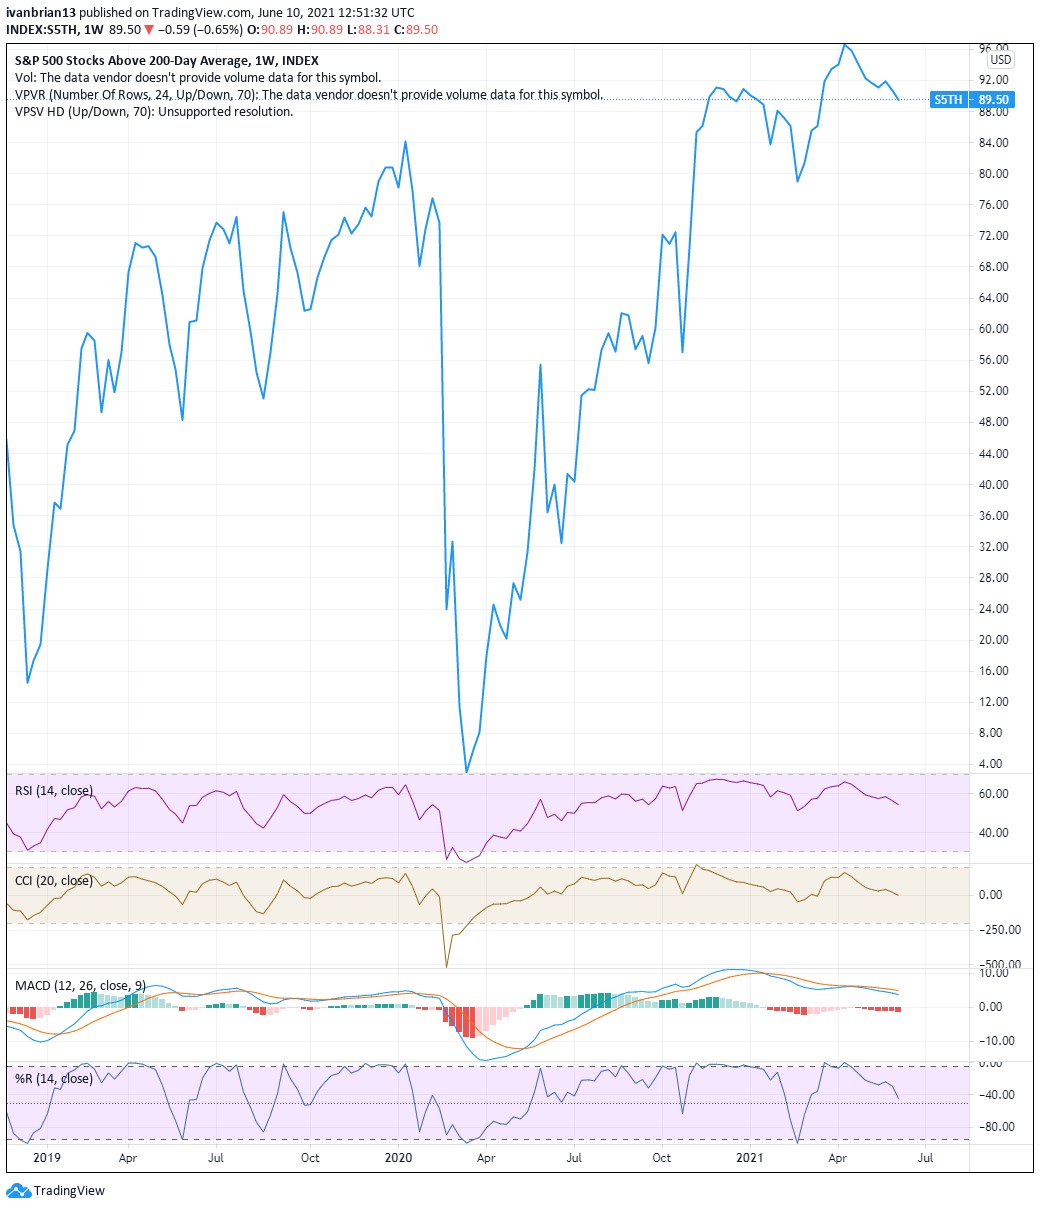
The surprising but not too surprising US CPI data has cleared one of the major concerns holding back equity markets. While the market remains bullish, the speed and strength of the ascent have been waning as investors begin to realize how strongly priced the majority of indices and stocks are. Many valuation metrics can be used based on numerous methods, but just take a simple look at the number of stocks in the S&P 500 trading above their 200-day moving average. Near record highs were hit in April. This measure neatly avoids fundamental metrics that change over time.
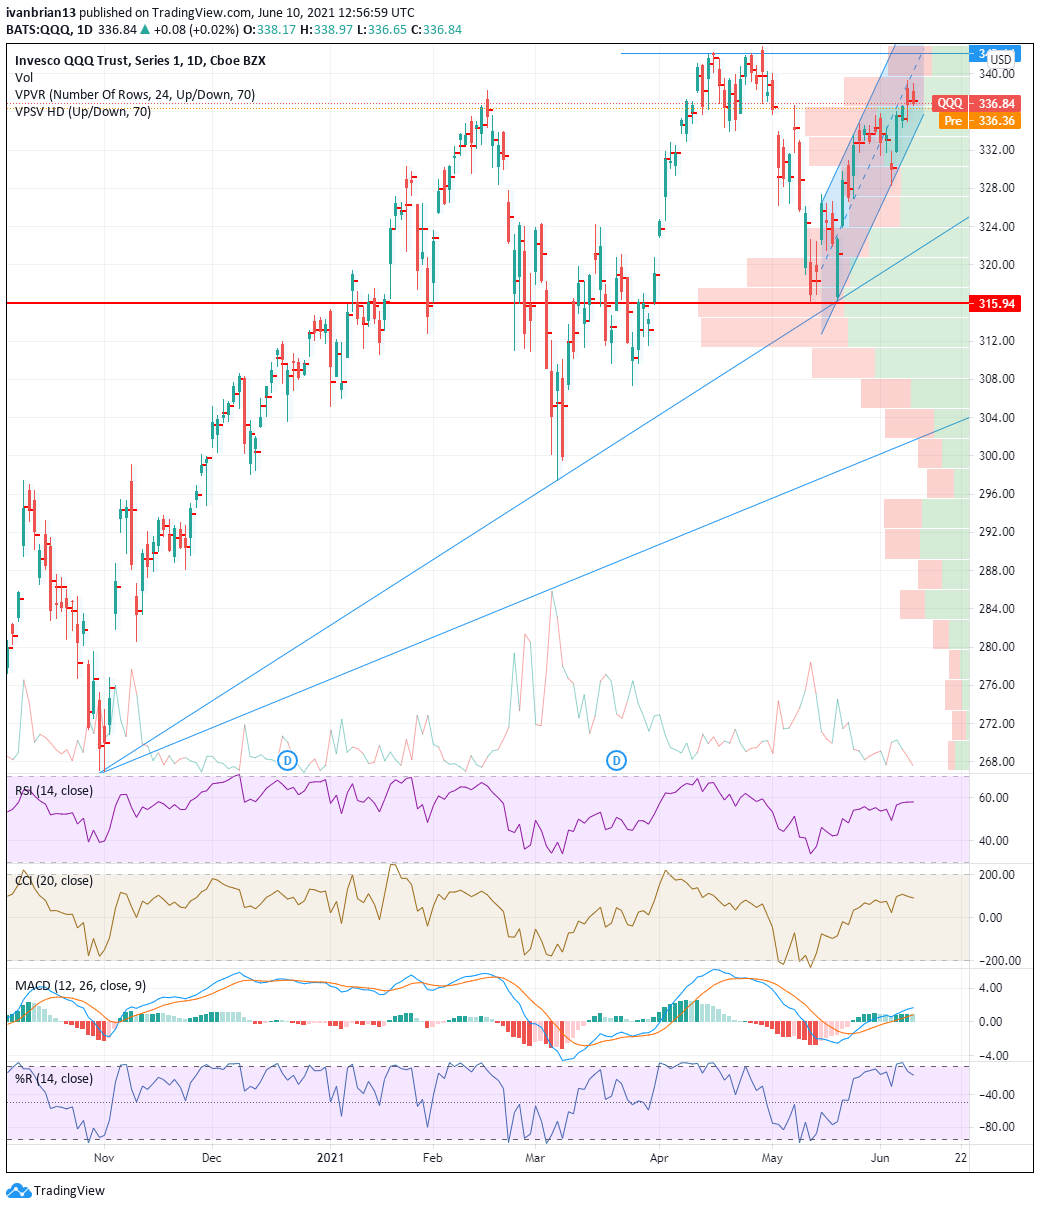
A nice uptrend channel continues to be adhered to as shown below. Support at 334.88 from the lower channel can be seen, as well as from 321.72, the longer-term trend line. The trend line below that traces from the October 2020 low gives support at 302.45. Of course, the market will not trade there anytime soon unless we get the fun of a flash crash again.
Author

Ivan Brian
FXStreet
Ivan Brian started his career with AIB Bank in corporate finance and then worked for seven years at Baxter. He started as a macro analyst before becoming Head of Research and then CFO.