NIO Stock News and Forecast: NIO makes pitstop at 100-day moving average to charge up
- NIO shares have rallied out of the wedge formation but stalled.
- Citi had helped the bulls by seeing a possible 50% upside.
- Markets on hold before US CPI, but NIO remains bullish.

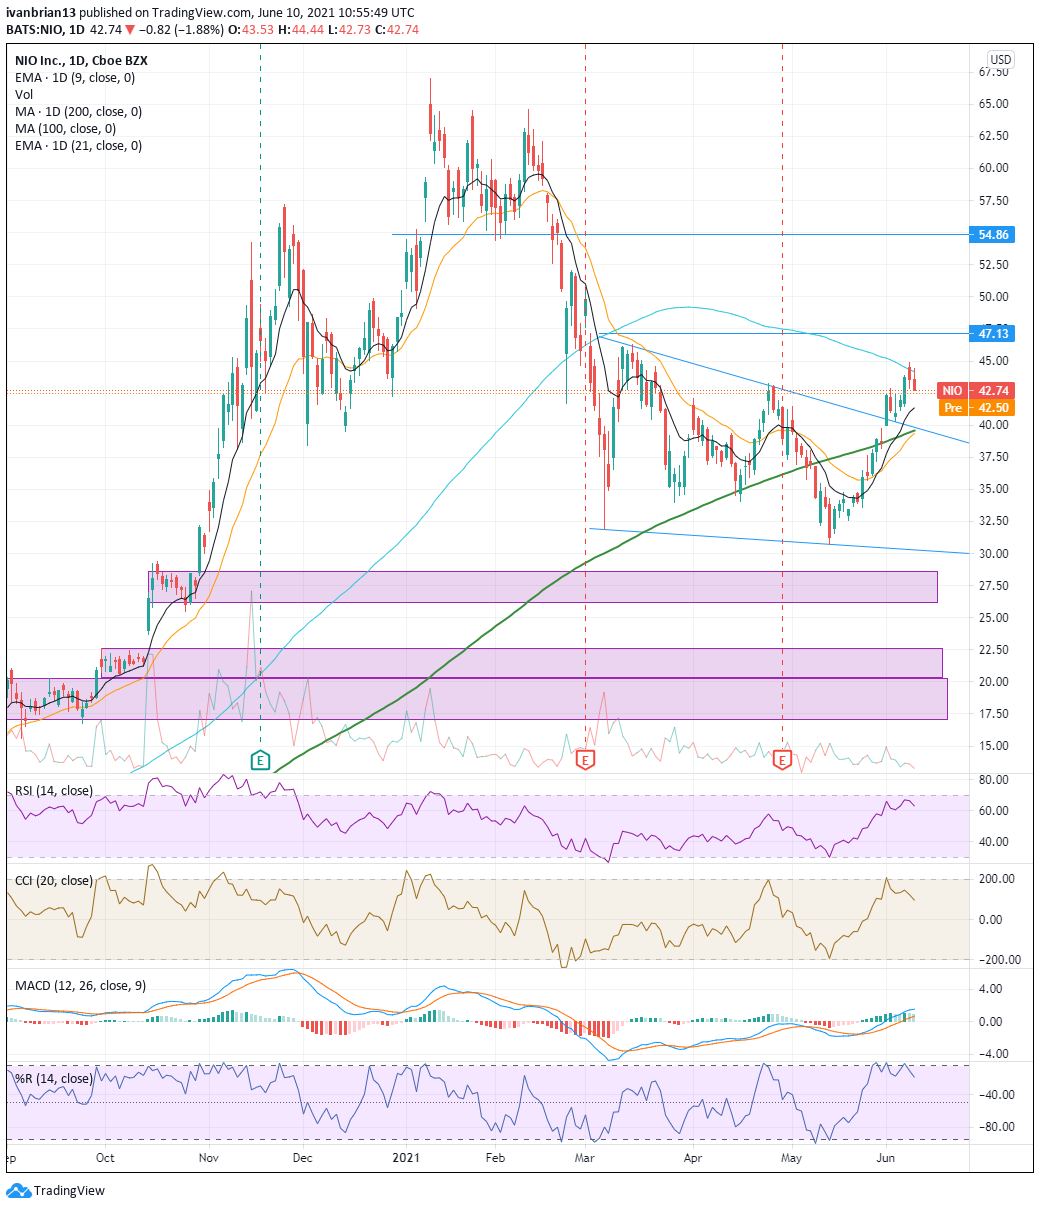
NIO shares staged a perfect wedge breakout, but the momentum has stalled somewhat at the 100-day moving average resistance. Time to charge up for a move higher perhaps? Activity in markets has been relatively subdued in the lead up to Thursday's US CPI data, apart from the meme stock space of course. NIO does have some meme features but has never quite seen the crazy single-day moves favoured by the 2021 headliners AMC and Gamestop (GME). NIO still did manage to register a 1,000% gain in 2020, so take that meme stocks. Recent delivery data from NIO and its peers have been positive and caused the wedge breakout. Always nice when fundamentals and technicals align.
NIO was charged and ready for the road last week as delivery data was strong and Citi said "expect NIO's monthly new order volumes in May-Jun[e] to be 20-30% higher than the average monthly level in 4Q20 peak season." Citi also mentioned it could see 50% upside in the shares. LiAuto (LI) chimed in with its own strong numbers as deliveries of the company's Li ONE car rose by 101% YoY. Xpeng (XPEV) CEO Brian Gu said, “We are on track to meet or exceed second-quarter delivery numbers, which I think means Chinese EV demand is still very strong.” All in all, there is plenty of positive news flow for the Chinese electric vehicle sector.
NIO stock forecast
Breaking out of the wedge formation is a bullish move and was backed up by the 9 and 21-day moving averages being broken also. Even more, momentum was given by the break of the long-term 200-day moving average. The first test will be resistance at $47.13 with $54.86 being the target of the wedge breakout. Some resistance has been encountered from the 100-day moving average at $44.15, but NIO still remains bullish with the 9-day moving average guiding the trend higher. Support comes just under the $40 level from the top of the wedge formation. Obviously, breaking this level ends the bullish argument. The 200-day moving average now sits at $39.58, making this a strong support area confluecing with the top of the wedge.
Longer term we have identified some strong support zones highlighted in purple. The momentum indicators and the Moving Average Convergence Divergence (MACD) remain in bullish formation.
Author

Ivan Brian
FXStreet
Ivan Brian started his career with AIB Bank in corporate finance and then worked for seven years at Baxter. He started as a macro analyst before becoming Head of Research and then CFO.