Mullen Automotive Stock Forecast: MULN craters 12% on Friday, putting it further away from $1 threshold
- MULN stock must maintain a share price above $1 for 10 consecutive sessions by September 5.
- Mullen announced on Thursday that it began repurchasing MULN shares on Wednesday.
- Mullen has already purchased $3.6 million worth of shares out of its $25 million mandate.
- Closing Thursday at $0.79, MULN stock needs to rise 26.6% to reach $1.00 – the threshold for retaining its NASDAQ listing.

Mullen Automotive (MULN) plunged 11.9% at the start of trading on Friday, making it look less likely it will make its way back to $1.00 in time to meet NASDAQ listing requirements. The stock is trading just above $0.69 at the time of writing, while the NASDAQ Composite is off 1%.
Mullen has its work cut out for it as the date for meeting the NASDAQ’s listing requirements is just days away. MULN stock – closing Thursday at $0.79 after selling off an astounding 19.4% – has just three sessions left to regain the $1.00 threshold for remaining listed. This means MULN needs to rally at least 26.6% from Thursday's closing price by the close of Tuesday, August 22.
Mullen stock news: MULN repurchases begin with $3.6 million buyback
On Thursday, Mullen announced that it had already used $3.626 million to repurchase 3.7 million shares of MULN stock. The repurchases began on Wednesday, August 16, but it has not stopped the share price from losing one-fifth of its value.
Additionally, CEO David Michery also bought 102,040 shares for an average price of $0.9842 on Wednesday. Following Mullen’s 1-for-9 reverse stock split on August 11, the company had somewhere around 71.5 million shares outstanding. With the repurchase policy in effect, there should be fewer than 68 million shares outstanding already.
NASDAQ Listing Rule 5810(c)(3)(H) states: “If a Company fails to meet the [Minimum Bid Price requirement], compliance is generally achieved by meeting the requirement for a minimum of ten consecutive business days.”
Since the market is closed on September 4 for the Labor Day holiday, this means that MULN stock must maintain a share price above $1.00 for every session between August 22 and September 5. After that, it is up to NASDAQ’s discretion. NASDAQ staff can take into account how far above the $1.00 threshold the shares trade at, average trading volumes and trend direction.
The Mullen board gave the leadership $25 million to spend on buybacks through the end of the year, so Mullen should have $21.4 million left to continue repurchasing. Expect MULN stock to move higher toward $1 over the next three sessions as management makes a last-ditch effort to retain its NASDAQ listing. If management fails to do so, then MULN stock will almost certainly slump drastically in September.
Mullen Automotive FAQs
What is Mullen Automotive?
Mullen Automotive is a publicly-traded development-stage electric vehicle company based in Brea, California that typically uses outside partnerships to manufacture its vehicles. The company was founded in 2014 and currently sells self-designed electric delivery vehicles. Besides its commercial offerings, Mullen plans to begin manufacturing its Mullen FIVE EV crossover in late 2024 or early 2025. Mullen Automotive went public on the NASDAQ exchange through a reverse merger in late 2021.
Who is the team behind Mullen Automotive?
David Michery has been the company’s CEO since he founded and incorporated the company in 2014. The existing company came from the merging of CODA Automotive and Mullen Motor Cars through acquisition. Michery is joined by Chief Financial Officer Jonathan New, Chief Commercial Officer John Schwegman and President of the Automotive Division Calin Popa.
What vehicles does Mullen Automotive currently offer?
Through a partnership with Randy Marion Automotive Group, Mullen distributes its Mullen One delivery van that has an electric range of 110 miles. Through an agreement with a Chinese manufacturer and distributor based in Ireland, the company also distributes the Mullen-GO Commercial Urban Delivery EV in Europe. In July 2023, Mullen will begin commercial production at its facility in Mississippi of its Class 3 EV Cab Chassis long-haul truck for immediate delivery. Through its 60% ownership stake in Bollinger Motors, Mullen will also reap the benefits of that company’s B1 SUV and B2 pickup truck, as well as other commercial vehicles in the future. The Mullen FIVE crossover vehicle is not slated for production until at least late 2024, but it is already taking reservations.
Why does MULN stock trade for such a low share price?
Mullen has been diluting its stock since going public in late 2021. This is because the company as of yet currently has little revenue from operations and no profits. The stock has fallen over 99% since the company’s reverse merger in November 2021, and the rapid dilution is mostly to blame. Taking into account Mullen’s 1-for-25 reverse stock split on May 4, 2023, Mullen had 33,338,727 shares outstanding on September 30, 2022, but 126,281,274 shares on March 31, 2023. The company is allowed to sell up to 200 million shares under current authorization.
Mullen stock forecast
When you’re desperately trying to maintain a listing price threshold, it’s not a good thing to hit a new all-time low. But that is just what MULN stock did on Thursday. Mullen stock broke below the $0.90 support level to close at $0.79.
The 21-day Simple Moving Average (SMA) sits at $1.10, so bulls or desperate shareholders better shoot for that level at least in order to maintain a safe distance from the $1 threshold.
With a market cap of $56.5 million, the more than $21 million available for repurchases could do serious damage and possibly even inflict a short squeeze. According to data from the end of July, just under 20% of shares were sold short at that time.
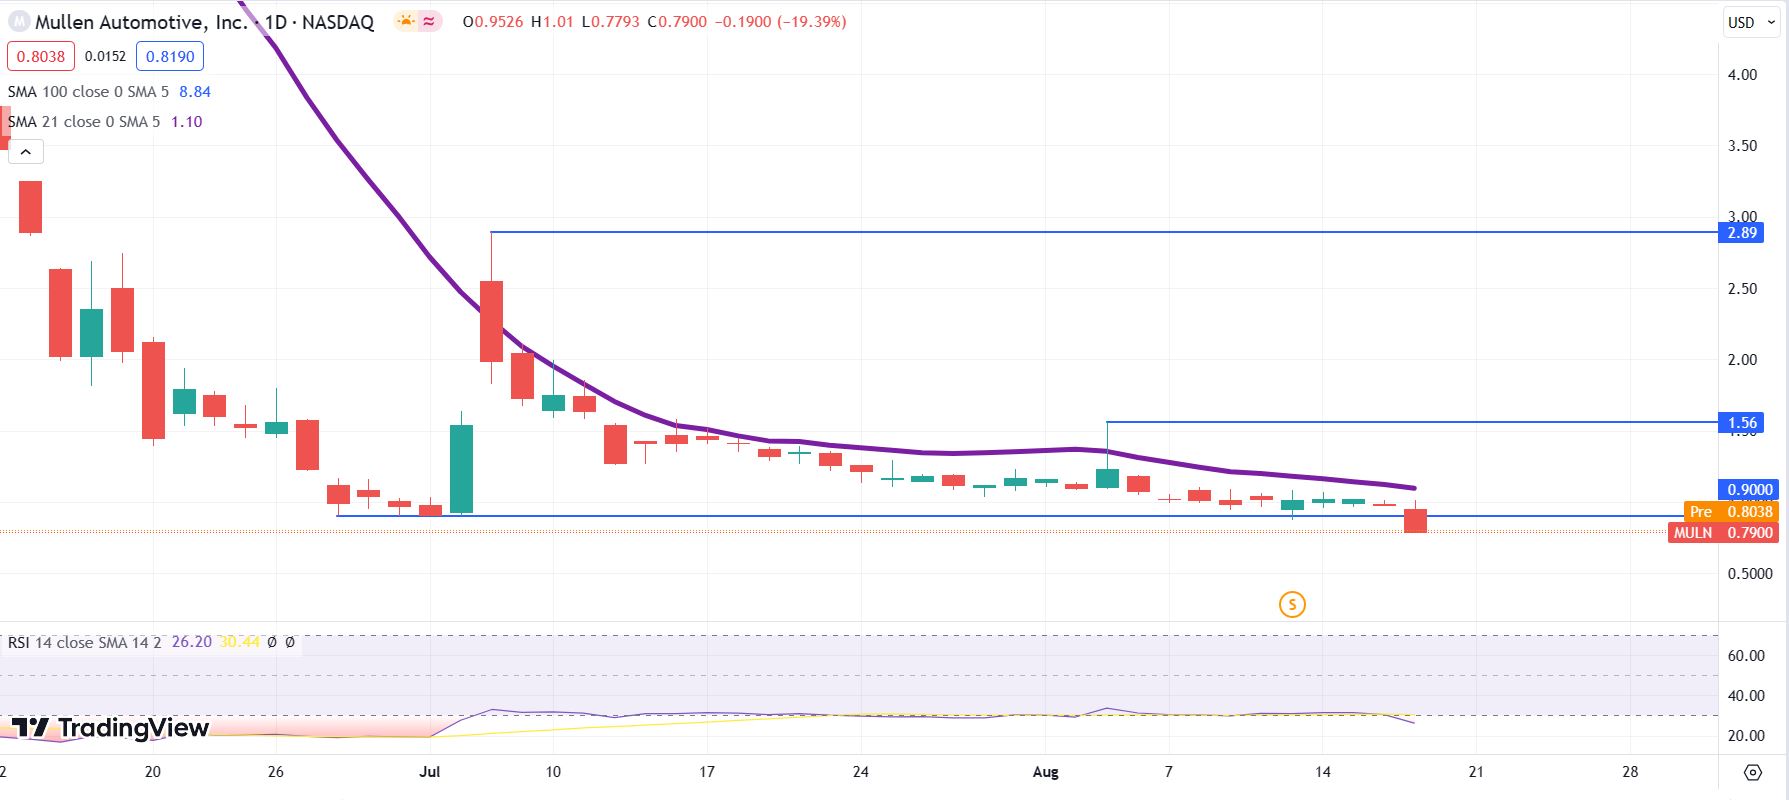
MULN daily chart
Author

Clay Webster
FXStreet
Clay Webster grew up in the US outside Buffalo, New York and Lancaster, Pennsylvania. He began investing after college following the 2008 financial crisis.















