Marathon Digital Stock Forecast: MARA dives 15% on Friday as Bitcoin loses 8%
- Marathon Digital Holdings plunged more than 15% on Friday.
- The peformance of MARA was in response to the crashing Bitcoin price, which lost about 8%.
- Heavy selling due to redemptions at the Grayscale Bitcoin Trust are to blame.
- MARA stock fell below an important support level and might continue trending lower toward support in the $14s.

Marathon Digital Holdings (MARA) stock offered up its second-straight day of double-digit losses after this week’s approval of spot Bitcoin ETFs launched a wave of institutional selling of the crypto market’s top asset.
MARA stock closed down 15.4% on Friday after losing more than 12% on Thursday, but that wasn't enough. The stock shed another 2% to fall below $18.50 in Friday's post-market. MARA has lost more than 21% of its value this week alone. Bitcoin sold off nearly 8% to trade beneath $43,000 on Friday after reaching a high near $49,000 on Thursday.
The NASDAQ Composite and S&P 500 had meagre gains on the day, while the Dow Jones lost over 0.3% due to its largest holding, UnitedHealth Group (UNH), reporting higher costs during its Q4 earnings call.
Marathon Digital stock news
Marathon Digital is yet another victim of the oft-said adage, “Buy the rumor, sell the news.” The US Securities & Exchange Commission (SEC) approved 11 spot Bitcoin ETFs on Wednesday, and they all began trading on Thursday.
Surprising to most traders but not too surprising to those who have long understood the above proverb, Bitcoin price has hemorrhaged in response to the ETFs going live. The price of BTC has risen more than 80% since early October, when BlackRock (BLK) filed to list a spot Bitcoin ETF with the regulator and other brokers followed suit, but BTC has collapsed since Thursday highs just under $49,000 to $43,500 on Friday.
Allowing equity market investors to pile into Bitcoin via an ETF is expected to greatly expand long-term demand for the godfather coin of crypto since most, and especially institutional investors, are wary of directly holding Bitcoin. However, investing via a spot ETF allows investors to grab a piece of the Bitcoin market without leaving the confines of the stock market and handing the complicated custody of crypto assets to the experts.
Selling the news, however, hasn’t been the only reason for Bitcoin to sell off. Reports have emerged that the Grayscale Bitcoin Trust (GBTC) is experiencing major investor flight. This is because investors in the Trust did not have the ability to sell their shares for years prior to Thursday when the Trust was converted into an ETF.
This has meant that long-time investors are streaming out of the once illiquid investment vehicle as redemptions flood the GBTC trading desk. GBTC has held as much as $25 billion worth of BTC ahead of the SEC’s ETF approval this week.
Crypto miners like Marathon Digital are then affected by the plunging BTC price, which could reduce revenue if this price action lingers for a longer period.
Dow Jones FAQs
What is the Dow Jones?
The Dow Jones Industrial Average, one of the oldest stock market indices in the world, is compiled of the 30 most traded stocks in the US. The index is price-weighted rather than weighted by capitalization. It is calculated by summing the prices of the constituent stocks and dividing them by a factor, currently 0.152. The index was founded by Charles Dow, who also founded the Wall Street Journal. In later years it has been criticized for not being broadly representative enough because it only tracks 30 conglomerates, unlike broader indices such as the S&P 500.
What factors impact the Dow Jones Industrial Average?
Many different factors drive the Dow Jones Industrial Average (DJIA). The aggregate performance of the component companies revealed in quarterly company earnings reports is the main one. US and global macroeconomic data also contributes as it impacts on investor sentiment. The level of interest rates, set by the Federal Reserve (Fed), also influences the DJIA as it affects the cost of credit, on which many corporations are heavily reliant. Therefore, inflation can be a major driver as well as other metrics which impact the Fed decisions.
What is Dow Theory?
Dow Theory is a method for identifying the primary trend of the stock market developed by Charles Dow. A key step is to compare the direction of the Dow Jones Industrial Average (DJIA) and the Dow Jones Transportation Average (DJTA) and only follow trends where both are moving in the same direction. Volume is a confirmatory criteria. The theory uses elements of peak and trough analysis. Dow’s theory posits three trend phases: accumulation, when smart money starts buying or selling; public participation, when the wider public joins in; and distribution, when the smart money exits.
How can I trade the DJIA?
There are a number of ways to trade the DJIA. One is to use ETFs which allow investors to trade the DJIA as a single security, rather than having to buy shares in all 30 constituent companies. A leading example is the SPDR Dow Jones Industrial Average ETF (DIA). DJIA futures contracts enable traders to speculate on the future value of the index and Options provide the right, but not the obligation, to buy or sell the index at a predetermined price in the future. Mutual funds enable investors to buy a share of a diversified portfolio of DJIA stocks thus providing exposure to the overall index.
Marathon Digital stock forecast
There is no doubt that Marathon Digital stock greatly benefited from the rally in Bitcoin price during the fourth quarter of last year. MARA rallied more than 200% during that period into early January.
Those with an eye on the BTC daily chart will notice that Bitcoin is testing the bottom trendline of the ascending price channel it has traded within since last October. A clear break there over the next few sessions should send Bitcoin price down to the $40,625 support floor that has largely held up since mid-December. Further support comes in at the $37,750 resistance-turned-support level that guided price action back in November.
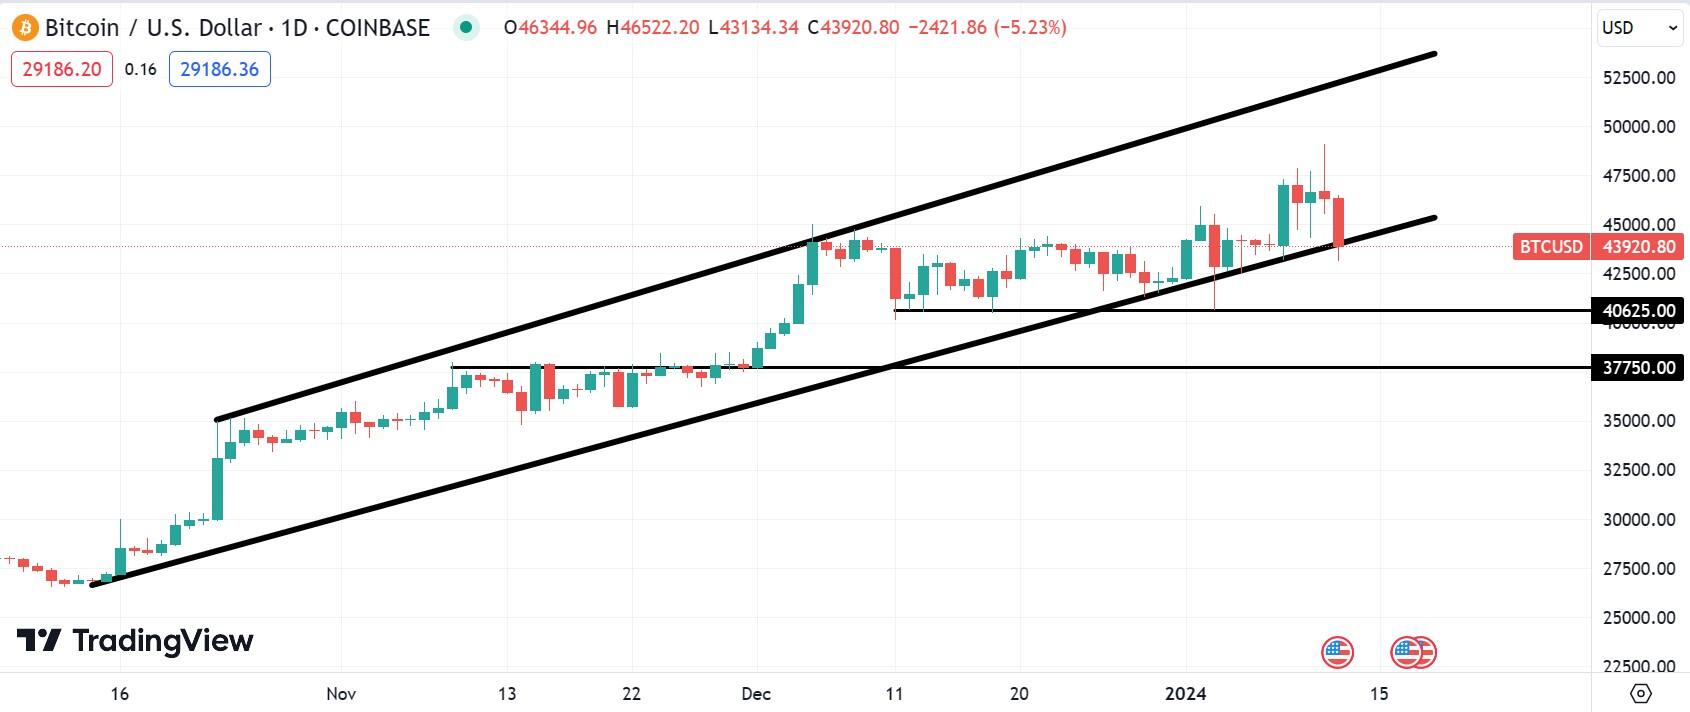
BTC-USD daily chart from Coinbase
Now that BTC price is backtracking, MARA will likely follow suit. MARA stock lost 12.6% on Thursday and another 15.4% on Friday. More importantly, MARA stock has already broken below the $20.33 support level. That level stems from December 19 and January 3 lows over the past few weeks.
Additionally, MARA stock has drifted below the 30-day moving average on Friday, which it hasn’t done in a meaningful way since October 23 of last year. Traders looking for an entry should focus on the support shelf between $14.07 and $14.80 that fortified the MARA price action between December 4 and December 12 just a month ago.
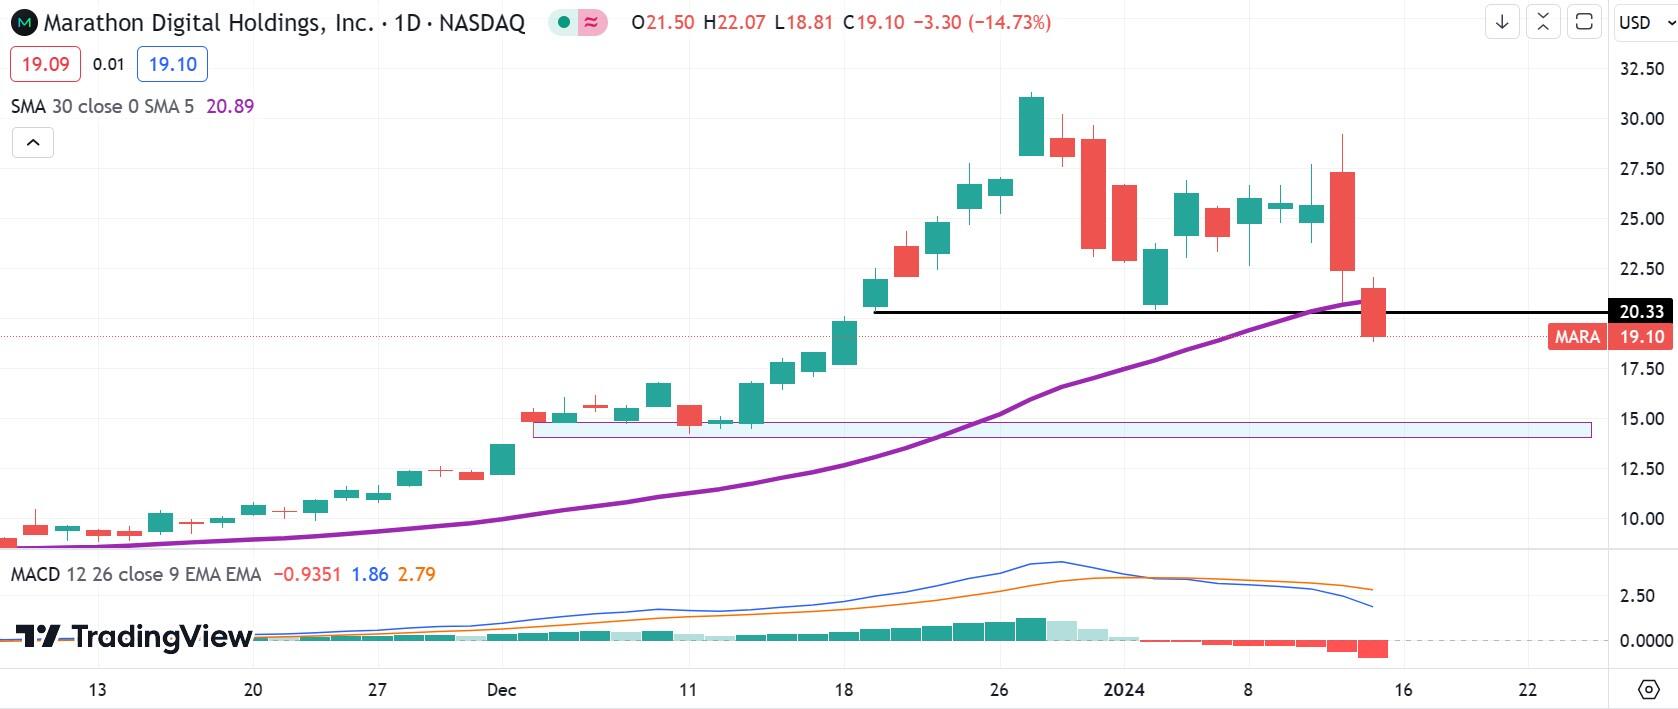
MARA daily chart
Author

Clay Webster
FXStreet
Clay Webster grew up in the US outside Buffalo, New York and Lancaster, Pennsylvania. He began investing after college following the 2008 financial crisis.


