Lululemon Athletica Stock News: LULU drained nearly 16% on trimmed sales outlook
- Lululemon Athletica plunges below $400 for first time in five months.
- Full-year guidance cut to $250 million below consensus.
- LULU stock halts fall near long-time support of $386.50.
- Q4 earnings and revenue arrive above consensus.

Wall Street favorite Lululemon Athletica (LULU) stock took a punch to the gut on Friday after management's 2024 revenue outlook underwhelmed analysts. The athleisure stock fell more than 18% at one point to $387, dropping below $400 for the first time since last November. However, LULU stock recovered somewhat to $403.19, down 15.8%, by the close close.
Call it a case of expectations getting too far ahead of the curve. Lululemon beat consensus forecasts for the fourth quarter, but that just wasn’t enough to satisfy traders.
The market opened slightly lower on Friday as it digested the previous two days of gains following Federal Reserve Chair Jerome Powell’s press conference in which he remained committed to cutting interest rates this year despite recent hints of inflation in the US economy. The NASDAQ closed up 0.16%, while the S&P 500 lost 0.14% and the Dow Jones receded 0.77%.
Nike (NKE) stock also sank 7% following earnings as the athletic brand pivoted to more innovative designs and said it will return to pushing its wholesale segment.
Lululemon Athletica stock news
The major factor in Friday’s sell-off was that the athleisure brand’s management released their 2024 full-year sales outlook. It came in a range from $10.7 billion to $10.8 billion, which was well below the $11 billion consensus from Wall Street analysts.
For the current quarter, Q1, management said sales would reach $2.18 to $2.2 billion, which was likewise below the $2.26 billion consensus. Essentially, this means that revenue is staying largely flat from recent quarters in mid-2023, but the guidance would still outflank Q1 2023 (fiscal Q1 2024) by about 9%.
Lululemon opened 25 new stores during the fourth quarter, which ended in December, and ended the period with a total of 711 stores.
In the fourth quarter, Lululemon earned $5.29 in GAAP earnings per share, which beat consensus by more than 5%. Revenue of $3.21 billion rose 16% YoY, besting consensus by a slight $10 million.
The rise in sales during Q4 was largely attributed to a 54% increase in international revenue. Overall, same store sales rose 12% YoY in the fourth quarter.
Another positive detail was management's guidance for the full year. The range was given for $14.00 to $15.20 in GAAP EPS, which overtakes existing consensus of $14.26.
Other good statistics involved Lululemon's margins. Gross margins rose from 55% to 59% YoY, but selling, general & administrative (SG&A) costs rose from 29% of revenue to 31%.
Dow Jones FAQs
The Dow Jones Industrial Average, one of the oldest stock market indices in the world, is compiled of the 30 most traded stocks in the US. The index is price-weighted rather than weighted by capitalization. It is calculated by summing the prices of the constituent stocks and dividing them by a factor, currently 0.152. The index was founded by Charles Dow, who also founded the Wall Street Journal. In later years it has been criticized for not being broadly representative enough because it only tracks 30 conglomerates, unlike broader indices such as the S&P 500.
Many different factors drive the Dow Jones Industrial Average (DJIA). The aggregate performance of the component companies revealed in quarterly company earnings reports is the main one. US and global macroeconomic data also contributes as it impacts on investor sentiment. The level of interest rates, set by the Federal Reserve (Fed), also influences the DJIA as it affects the cost of credit, on which many corporations are heavily reliant. Therefore, inflation can be a major driver as well as other metrics which impact the Fed decisions.
Dow Theory is a method for identifying the primary trend of the stock market developed by Charles Dow. A key step is to compare the direction of the Dow Jones Industrial Average (DJIA) and the Dow Jones Transportation Average (DJTA) and only follow trends where both are moving in the same direction. Volume is a confirmatory criteria. The theory uses elements of peak and trough analysis. Dow’s theory posits three trend phases: accumulation, when smart money starts buying or selling; public participation, when the wider public joins in; and distribution, when the smart money exits.
There are a number of ways to trade the DJIA. One is to use ETFs which allow investors to trade the DJIA as a single security, rather than having to buy shares in all 30 constituent companies. A leading example is the SPDR Dow Jones Industrial Average ETF (DIA). DJIA futures contracts enable traders to speculate on the future value of the index and Options provide the right, but not the obligation, to buy or sell the index at a predetermined price in the future. Mutual funds enable investors to buy a share of a diversified portfolio of DJIA stocks thus providing exposure to the overall index.
Lululemon stock forecast
LULU stock halted its sell-off at an intraday low on Friday of $387.11. That is a good sign for worried shareholders and also seems to have beckoned bulls to enter there as the price rebounded off that low. This is because the $386.50 support/resistance level has featured in the price action about a dozen times since December 2022.
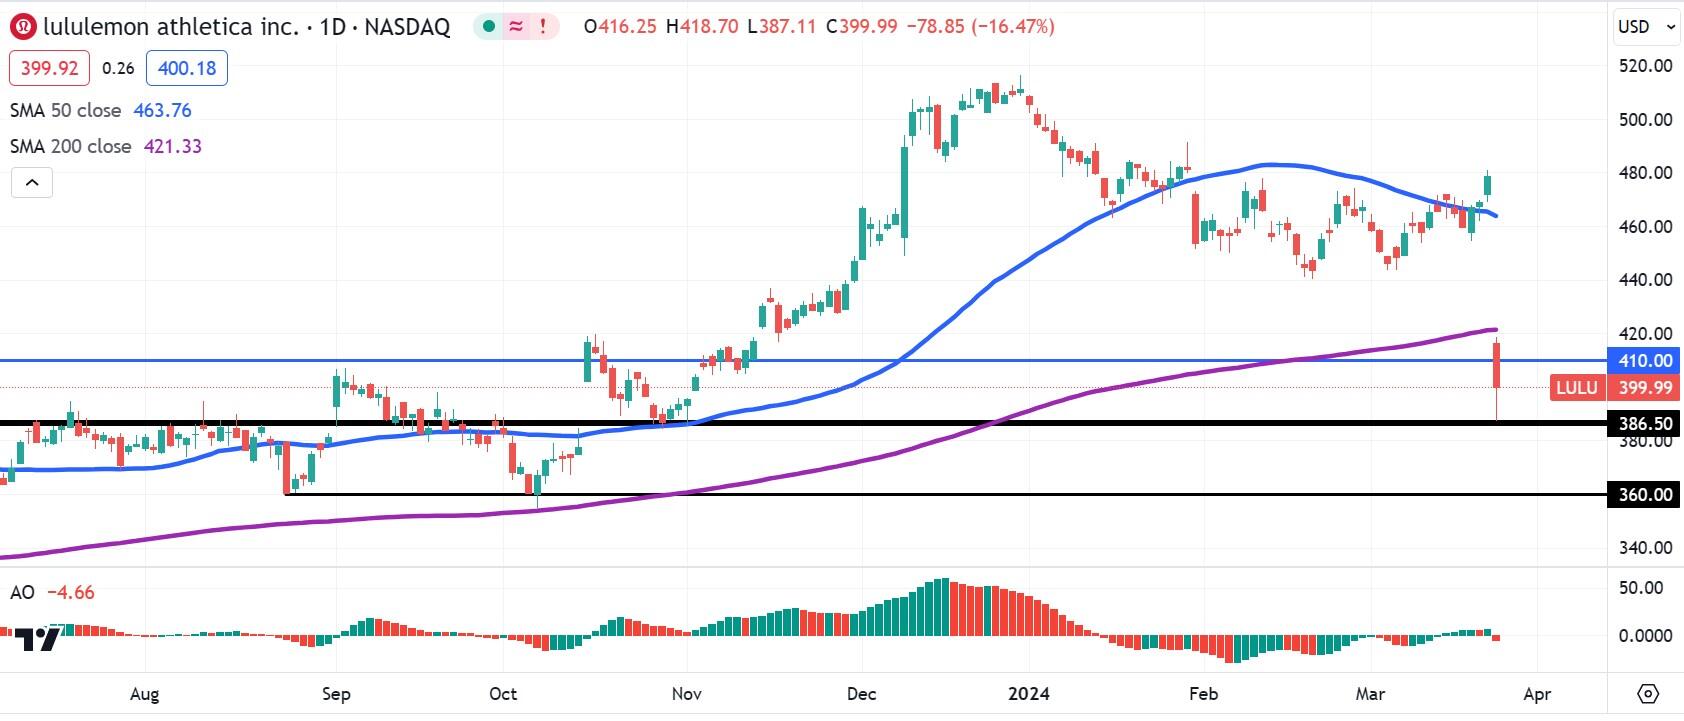
LULU daily stock chart
Premium
You have reached your limit of 3 free articles for this month.
Start your subscription and get access to all our original articles.
Author

Clay Webster
FXStreet
Clay Webster grew up in the US outside Buffalo, New York and Lancaster, Pennsylvania. He began investing after college following the 2008 financial crisis.