Jumia Technologies Stock Forecast: JMIA launches second day of extraordinary rally
- JMIA advances another 9% on Wednesday, regains $12 threshold.
- Jumia stock has been in an uptrend since late February.
- Benchmark gives JMIA a $14 price target.
- Analyst thinks African demographics could mean decades of growth ahead.

Jumia Technologies (JMIA), known by reputation as the African Amazon (AMZN) for its ecommerce speciality and other digital offerings, is surging again on Wednesday. Shares of the company, which trade on the New York Stock Exchange, are up more than 9% at the time of writing, following Tuesday’s near 30% run.
This is somewhat surprising to those of us who have not been paying attention since it collapsed by over 90% from its pandemic-era high near $70 to a low of $2.23 last September. JMIA shares have actually been in an uptrend since late February, but only now is the wider market taking notice. JMIA is up more than 220% year to date.
Jumia stock news: JMIA is back
The latest rally owes in no small part to an upgrade from Benchmark on Tuesday. The firm presented Jumia stock with a Buy rating after initiating coverage. It also tacked on a $14 price target, which gives traders a new bullseye.
Benchmark analyst Fawne Jiang mentioned that African demographics of a rising youth population bode well for Jumia’s primary market focus on the continent.
Jiang, who covers global ecommerce, said that Jumia stands to benefit from "multi-year and potentially multi-decade e-commerce growth” across the African continent.
Jumia has been losing money for more than a decade but has continued to seek outside investment and grow its large offering of platforms and products. Many bulls have noted that Jumia’s cash burn of ~$50 million in the past year is just a quarter of what it was several years ago.
Profitability may be several years off, but it appears that Jumia is heading in that direction.
Penny stocks FAQs
Originally, penny stocks were any stock that traded for less than $1, i.e. pennies. The Securities & Exchange Commission has since altered the definition to include any stock that trades for less than $5. Penny stocks are typically associated with small companies that have either experienced poor results, sending their share price down, or with companies who dilute their share price by issuing lots of shares over time in order to fund operations or acquisitions.
Some penny stocks trade on respected exchanges, such as the NASDAQ or the NYSE. Examples of these are Mullen Automotive (MULN) and Bark (BARK). Those exchanges have requirements though. For the NYSE, listed stocks must have 1.1 million publicly traded shares outstanding with a market value of at least $40 million. The NASDAQ requires a share price minimum of $4, a minimum of 1.25 million shares and a market cap of $45 million. Most penny stocks, however, trade on the OTC (over-the-counter) market. This may mean the OTC Bulletin Board or the privately-owned OTC Markets Group.
Quite often the sharpest movers on any normal trading day are found among penny stocks. This is because non-penny stocks tend to have more liquidity, and the market is more certain about larger companies’ long-term values. Penny stocks are illiquid, meaning there is little supply available if an announcement drives more buying demand into a particular stock. There are no market makers that hold large amounts of penny stocks just to dispense them at a slightly higher price point. Additionally, most of these penny stocks suffer from a news desert where few market players know anything relevant about them. This is why a small biopharma company can issue news about a successful drug trial and immediately rocket 500% higher, with no analysts on Wall Street covering it.
Typically, the answer is “No”. Penny stocks are more risky than higher-priced stocks on average. Penny stock investors have a higher chance of losing their capital by investing in weaker companies. There is a reason why they are penny stocks in the first place, which is that largely the mainstream market is not interested in investing in them. Two groups of investors tend to focus on penny stocks, however. The first group are day traders, who know that the lack of liquidity in penny stocks could lead to extremely large swings over a short time period. The other group is made up of investors who like the fact that these stocks are disregarded. This allows these investors to gain an advantage by benefiting from upcoming announcements, because the larger market is not paying attention.
Jumia stock forecast
Jumia stock has now left its penny stock status behind, and shareholders are hoping that the change is for good. The JMIA high of the day at $12.09 was a little below past resistance from April 2022 at $12.53. Above there, there are few historical points of note until $17.00, which acted as resistance in August and September 2021.
The 9-day and 20-day Simple Moving Averages (SMA) are bunched up near $8.40, which means any pullback in the near term could be severe if that level is required to act as support. But the Moving Average Convergence Divergence (MACD) is pointing higher, and JMIA does not look ready to let go of the current rally. For now, most traders will expect JMIA to reach the Benchmark target at $14.00.
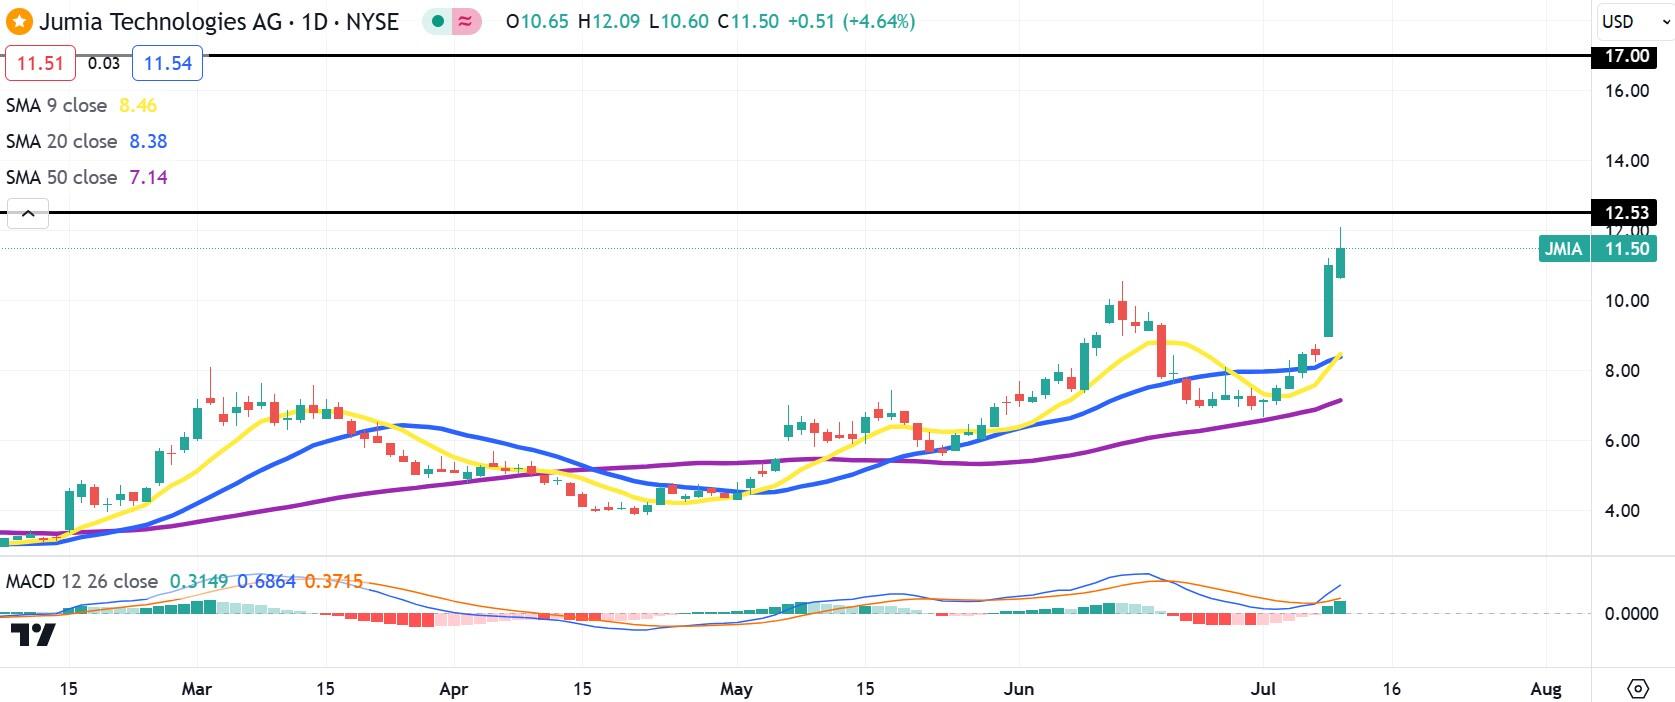
JMIA daily stock chart
Premium
You have reached your limit of 3 free articles for this month.
Start your subscription and get access to all our original articles.
Author

Clay Webster
FXStreet
Clay Webster grew up in the US outside Buffalo, New York and Lancaster, Pennsylvania. He began investing after college following the 2008 financial crisis.


