Gold trades little changed as Fed rate-cut expectations sustain
- Gold trades flat on low holiday volumes as US bond markets close for Juneteenth-day celebrations.
- Fed officials continue to toe the official line on interest rates, advocating a cautious, data-driven approach.
- XAU/USD continues forming a bearish Head-and-Shoulders pattern on the daily chart.

Gold (XAU/USD) trades in a tight range in the $2,320s in quiet markets on Wednesday. A lack of risk sentiment and low holiday volume caps volatility in the safe-haven asset.
The US Dollar (USD) – to which Gold is negatively correlated – trades broadly unchanged and since US bond markets are closed for the Juneteenth day holiday, the benchmark US 10-year Treasury bond yield remains stuck at 4.2270%, Tuesday’s close, according to data from Trading Economics.
Gold edged up on Tuesday after weak US Retail Sales
Gold closed higher on Tuesday after the release of weak US Retail Sales data led to a downward revision in the outlook for US interest rates. The lower-than-expected Retail Sales in May suggests lower consumer spending, which would likely also result in a fall in inflation. Lower inflation, in turn, would result in the Federal Reserve (Fed) moving to cut interest rates.
From markets seeing only a 50/50 chance of the Federal Reserve (Fed) cutting interest rates at its September meeting, the probability rose to 60% after the data release, according to the CME FedWatch Tool, which bases its estimates on the market price of Fed Funds Futures.
However, futures markets appear to be more optimistic than recent Fed commentary would seem to suggest. At its June meeting the Fed revised its projections for the Fed Funds Rate higher. From expecting three 0.25% cuts in 2024 in their March meeting projections, Fed officials saw only one cut in 2024 in June, on account of stubborn inflation. The expectation of interest rates remaining higher for longer was negative for non-yielding Gold, as it raises the opportunity cost of holding the precious metal.
On Tuesday a long list of Fed officials made public their opinions about monetary policy. Most towed the official line that more data was needed showing inflation coming down in a sustainable manner before they would cut interest rates (bullish for Gold). Their views are summarized below:
- Boston Fed President Susan Collins said it was too soon to conclude inflation was falling.
- Progress on inflation remained gradual, according to Fed Board of Governors member Adriana Kugler.
- If inflation figures became stuck above the Fed's 2.0% target, St. Louis Fed President Alberto Musalem would be prepared to raise interest rates. Musalem added that it could take months or even entire quarters before Fed policy wins the battle against above-target inflation.
- Lorie Logan, the President of the Dallas Federal Reserve, said that the recent data indicating a slowdown in inflation is "encouraging," but emphasized that the Fed must remain cautious and patient regarding interest-rate policy.
- The latest update to the Consumer Price Index (CPI) was "excellent", according to Chicago Fed President Austan Goolsbee, referring to the below-expectations May data. Goolsbee added he hoped to see more of the same in future inflation prints.
Technical Analysis: Gold forms Head-and-Shoulders top
Gold seems to be completing a bearish Head-and-Shoulders (H&S) price pattern on the daily chart. These patterns tend to occur at market tops and signal a change of trend.
XAU/USD Daily Chart
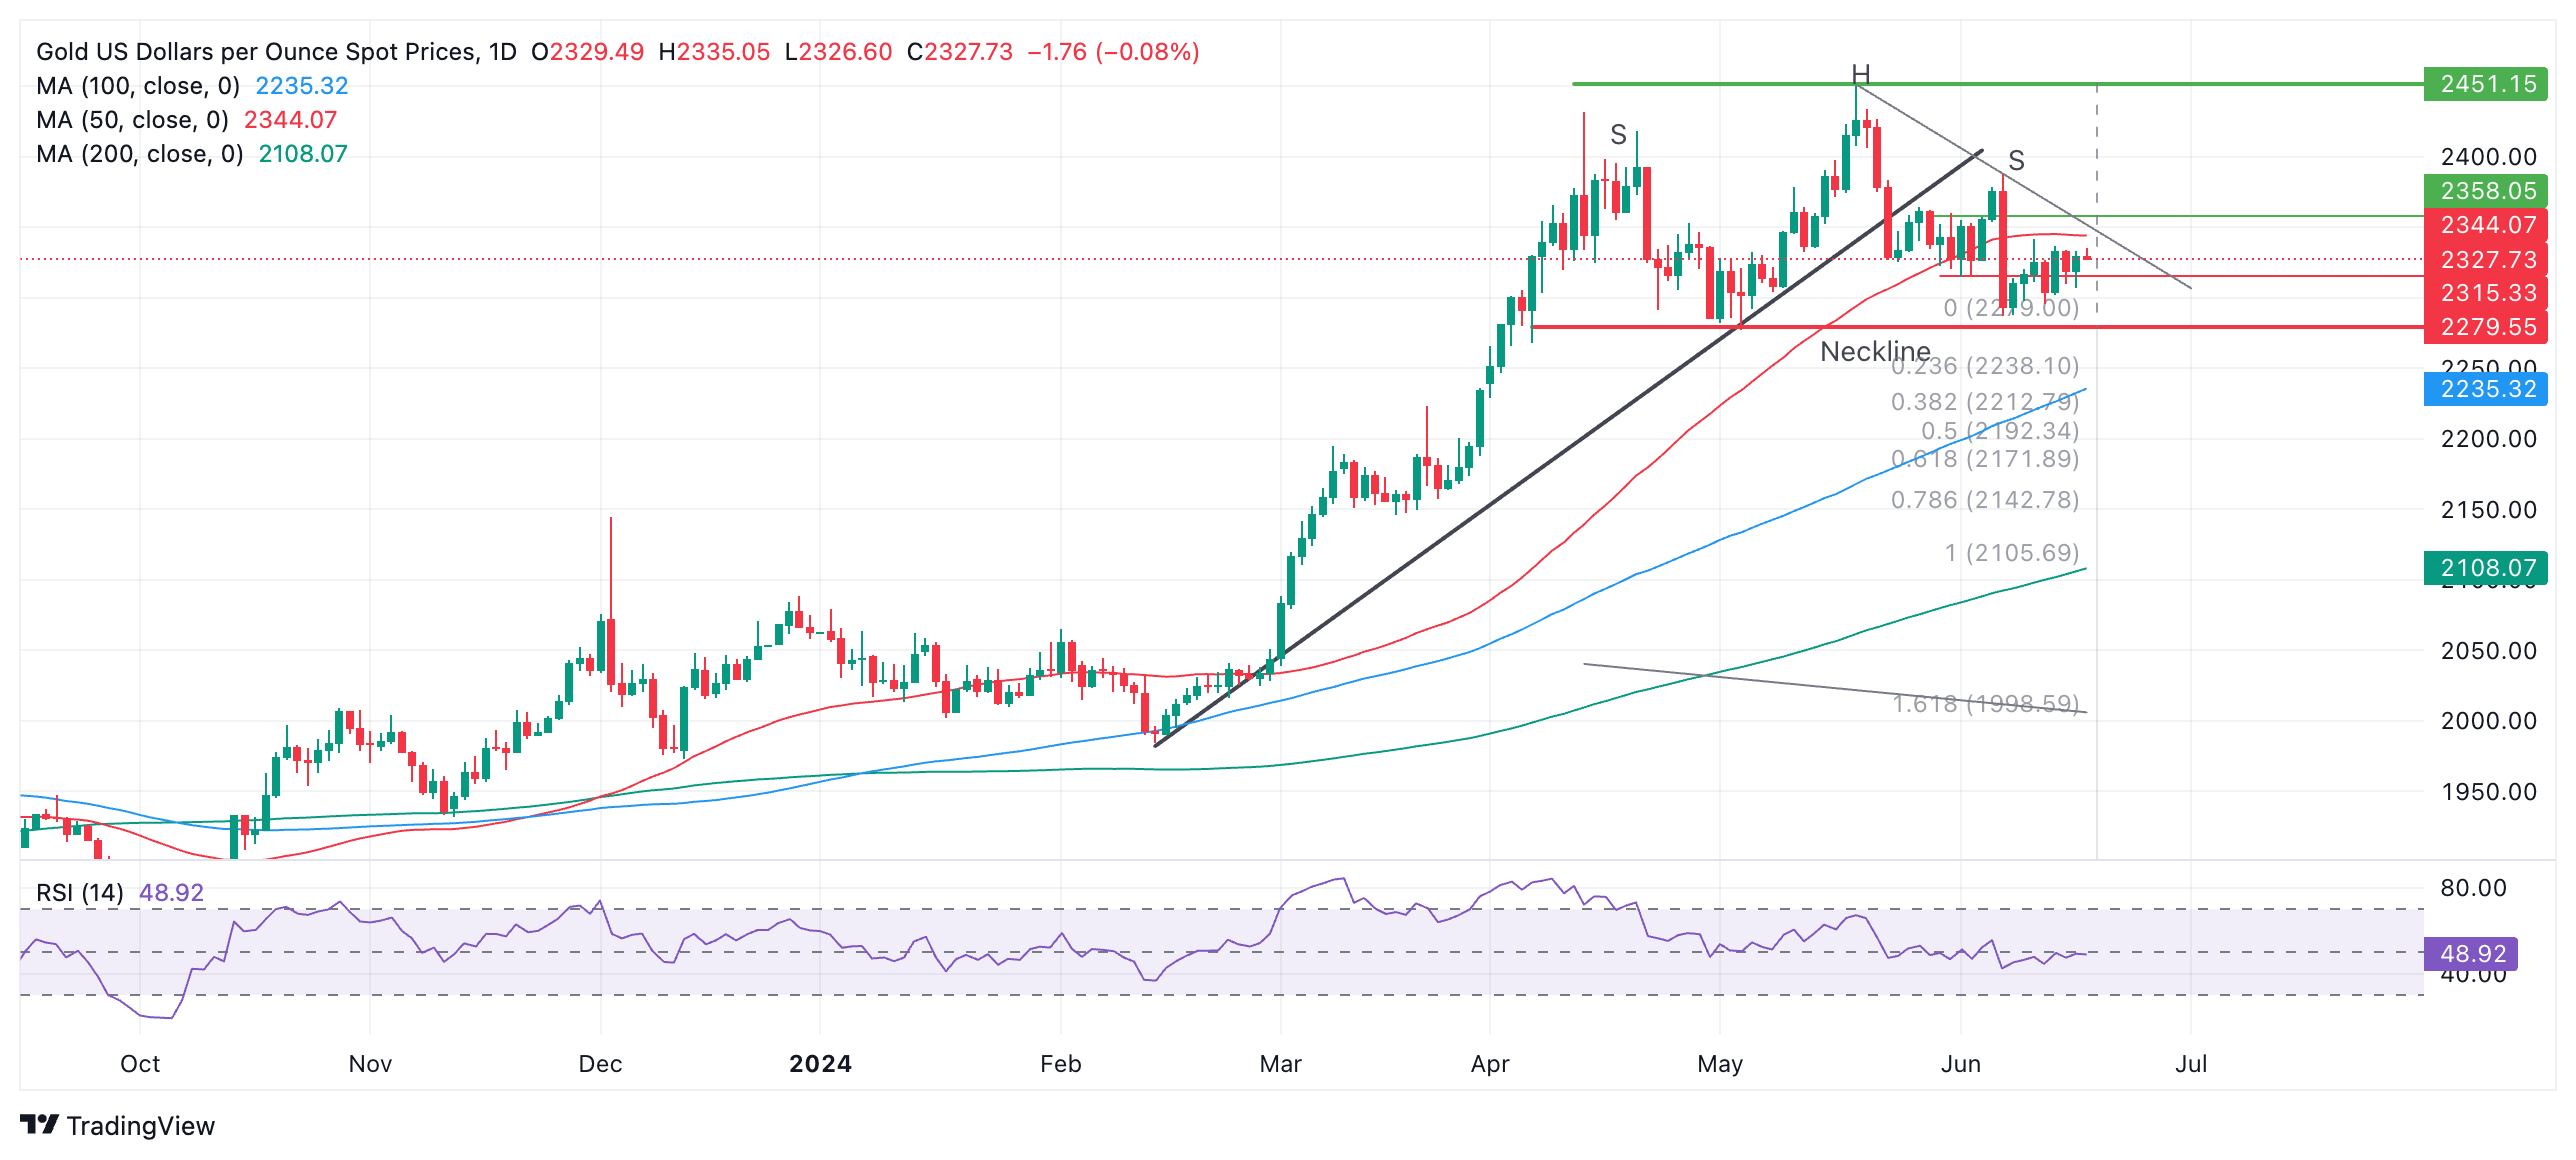
The H&S on Gold has completed a left and right shoulder (labeled “S”) and a “head” (labeled “H”). The so-called “neckline” of the pattern appears to be at the $2,279 support level (red line).
The declining momentum signaled by the Relative Strength Index (RSI) during its development corroborates the pattern.
A decisive break below the neckline would validate the H&S pattern and activate downside targets. The first more conservative target would be $2,171, calculated by taking the 0.618 Fibonacci ratio of the height of the pattern and extrapolating it lower from the neckline. The second target would be at $2,106, the full height of the pattern extrapolated lower.
A break above $2,345, however, would bring the H&S into doubt and could signal a continuation higher, to an initial target at the $2,450 peak.
Gold FAQs
Gold has played a key role in human’s history as it has been widely used as a store of value and medium of exchange. Currently, apart from its shine and usage for jewelry, the precious metal is widely seen as a safe-haven asset, meaning that it is considered a good investment during turbulent times. Gold is also widely seen as a hedge against inflation and against depreciating currencies as it doesn’t rely on any specific issuer or government.
Central banks are the biggest Gold holders. In their aim to support their currencies in turbulent times, central banks tend to diversify their reserves and buy Gold to improve the perceived strength of the economy and the currency. High Gold reserves can be a source of trust for a country’s solvency. Central banks added 1,136 tonnes of Gold worth around $70 billion to their reserves in 2022, according to data from the World Gold Council. This is the highest yearly purchase since records began. Central banks from emerging economies such as China, India and Turkey are quickly increasing their Gold reserves.
Gold has an inverse correlation with the US Dollar and US Treasuries, which are both major reserve and safe-haven assets. When the Dollar depreciates, Gold tends to rise, enabling investors and central banks to diversify their assets in turbulent times. Gold is also inversely correlated with risk assets. A rally in the stock market tends to weaken Gold price, while sell-offs in riskier markets tend to favor the precious metal.
The price can move due to a wide range of factors. Geopolitical instability or fears of a deep recession can quickly make Gold price escalate due to its safe-haven status. As a yield-less asset, Gold tends to rise with lower interest rates, while higher cost of money usually weighs down on the yellow metal. Still, most moves depend on how the US Dollar (USD) behaves as the asset is priced in dollars (XAU/USD). A strong Dollar tends to keep the price of Gold controlled, whereas a weaker Dollar is likely to push Gold prices up.
Author

Joaquin Monfort
FXStreet
Joaquin Monfort is a financial writer and analyst with over 10 years experience writing about financial markets and alt data. He holds a degree in Anthropology from London University and a Diploma in Technical analysis.


