Gold pushes back above $2,500 as 50 bps rate cut bets diminish
- Gold trades within the guard rails of a familiar range above the $2,500 barrier.
- Traders are weighing up the possibility of the Fed going ahead with a larger-than-usual 50 bps cut to interest rates.
- Such a cut would be bullish for Gold given it is a non-interest paying asset.

Gold (XAU/USD) is exchanging hands above $2,500 on Tuesday, sticking within its familiar range of the last few weeks as traders assess the outlook for monetary policy and the future path of interest rates in the US, a key performance indicator for Gold.
Recent mixed US jobs’ data brought into doubt market expectations of the Federal Reserve (Fed) making an above-standard 0.50% (50 bps) cut to its fed funds rate at the September 18 meeting. This, in turn, had a negative impact on Gold, which tends to appreciate the more interest rates fall because that increases its attractiveness to investors as a non-interest paying asset.
Gold: Focus on US inflation and geopolitics
Gold rose then fell after the Nonfarm Payrolls report on Friday, as although the headline figure showed the US economy added fewer jobs than expected in August, the Unemployment Rate fell to 4.2% from 4.3% as anticipated, and wage growth increased above forecasts.
Taken as a whole, the report indicated that the labor market was not in as bad shape as first thought and that wage inflation was rising. As a result, market-based probabilities of the Fed cutting interest rates by 0.50% actually fell from around 40% to around 30%; on Tuesday they have fallen even lower to 27%.
After an initial spike, Gold quickly rolled over and ended the week back down at around the $2,500 mark before inching slightly lower into the $2,490s on Monday. On Tuesday, Gold has edged back just above $2,500.
Investors now await US Consumer Price Index (CPI) and Producer Price Index (PPI) data for August, which will be out on Wednesday and Thursday, respectively, for more intel on the outlook for interest rates. Although analysts are mixed as to how much of an impact inflation data will now have on policy expectations, some, such as Deutsche Bank’s Head of Macro Research, Jim Reid, play down the importance of inflation compared to employment data.
“Wednesday's US CPI and Thursday's PPI will probably help move that debate on, but it seems employment is more important at the moment and Friday's mixed employment report had arguments for both sides, so the swing factor is probably how the committee view labor markets rather than inflation,” said Reid in his “Early Morning Reid” macro note.
On the geopolitical risk front, the war in Gaza escalates after the Israelis bombed a displaced civilian camp in southern Gaza, killing 33 people in a single day, according to Al Jazeera News. US efforts at brokering a ceasefire deal now seem even less likely to succeed than a few days ago.
Meanwhile, in the other geopolitical hotspot of Ukraine, Russian forces continue to close in on the key logistics hub city of Pokrovsk despite gains by Ukraine in Russia’s Kursk region.
Overall, the heightening tensions are probably supporting Gold, given its safe-haven status.
Technical Analysis: In the middle of the range, holding at around $2,500
Gold (XAU/USD) continues trading in a sideways range between the all-time highs of $2,531 and a floor at around the $2,475 level. It is currently exchanging hands more or less in the middle of that range.
XAU/USD 4-hour Chart
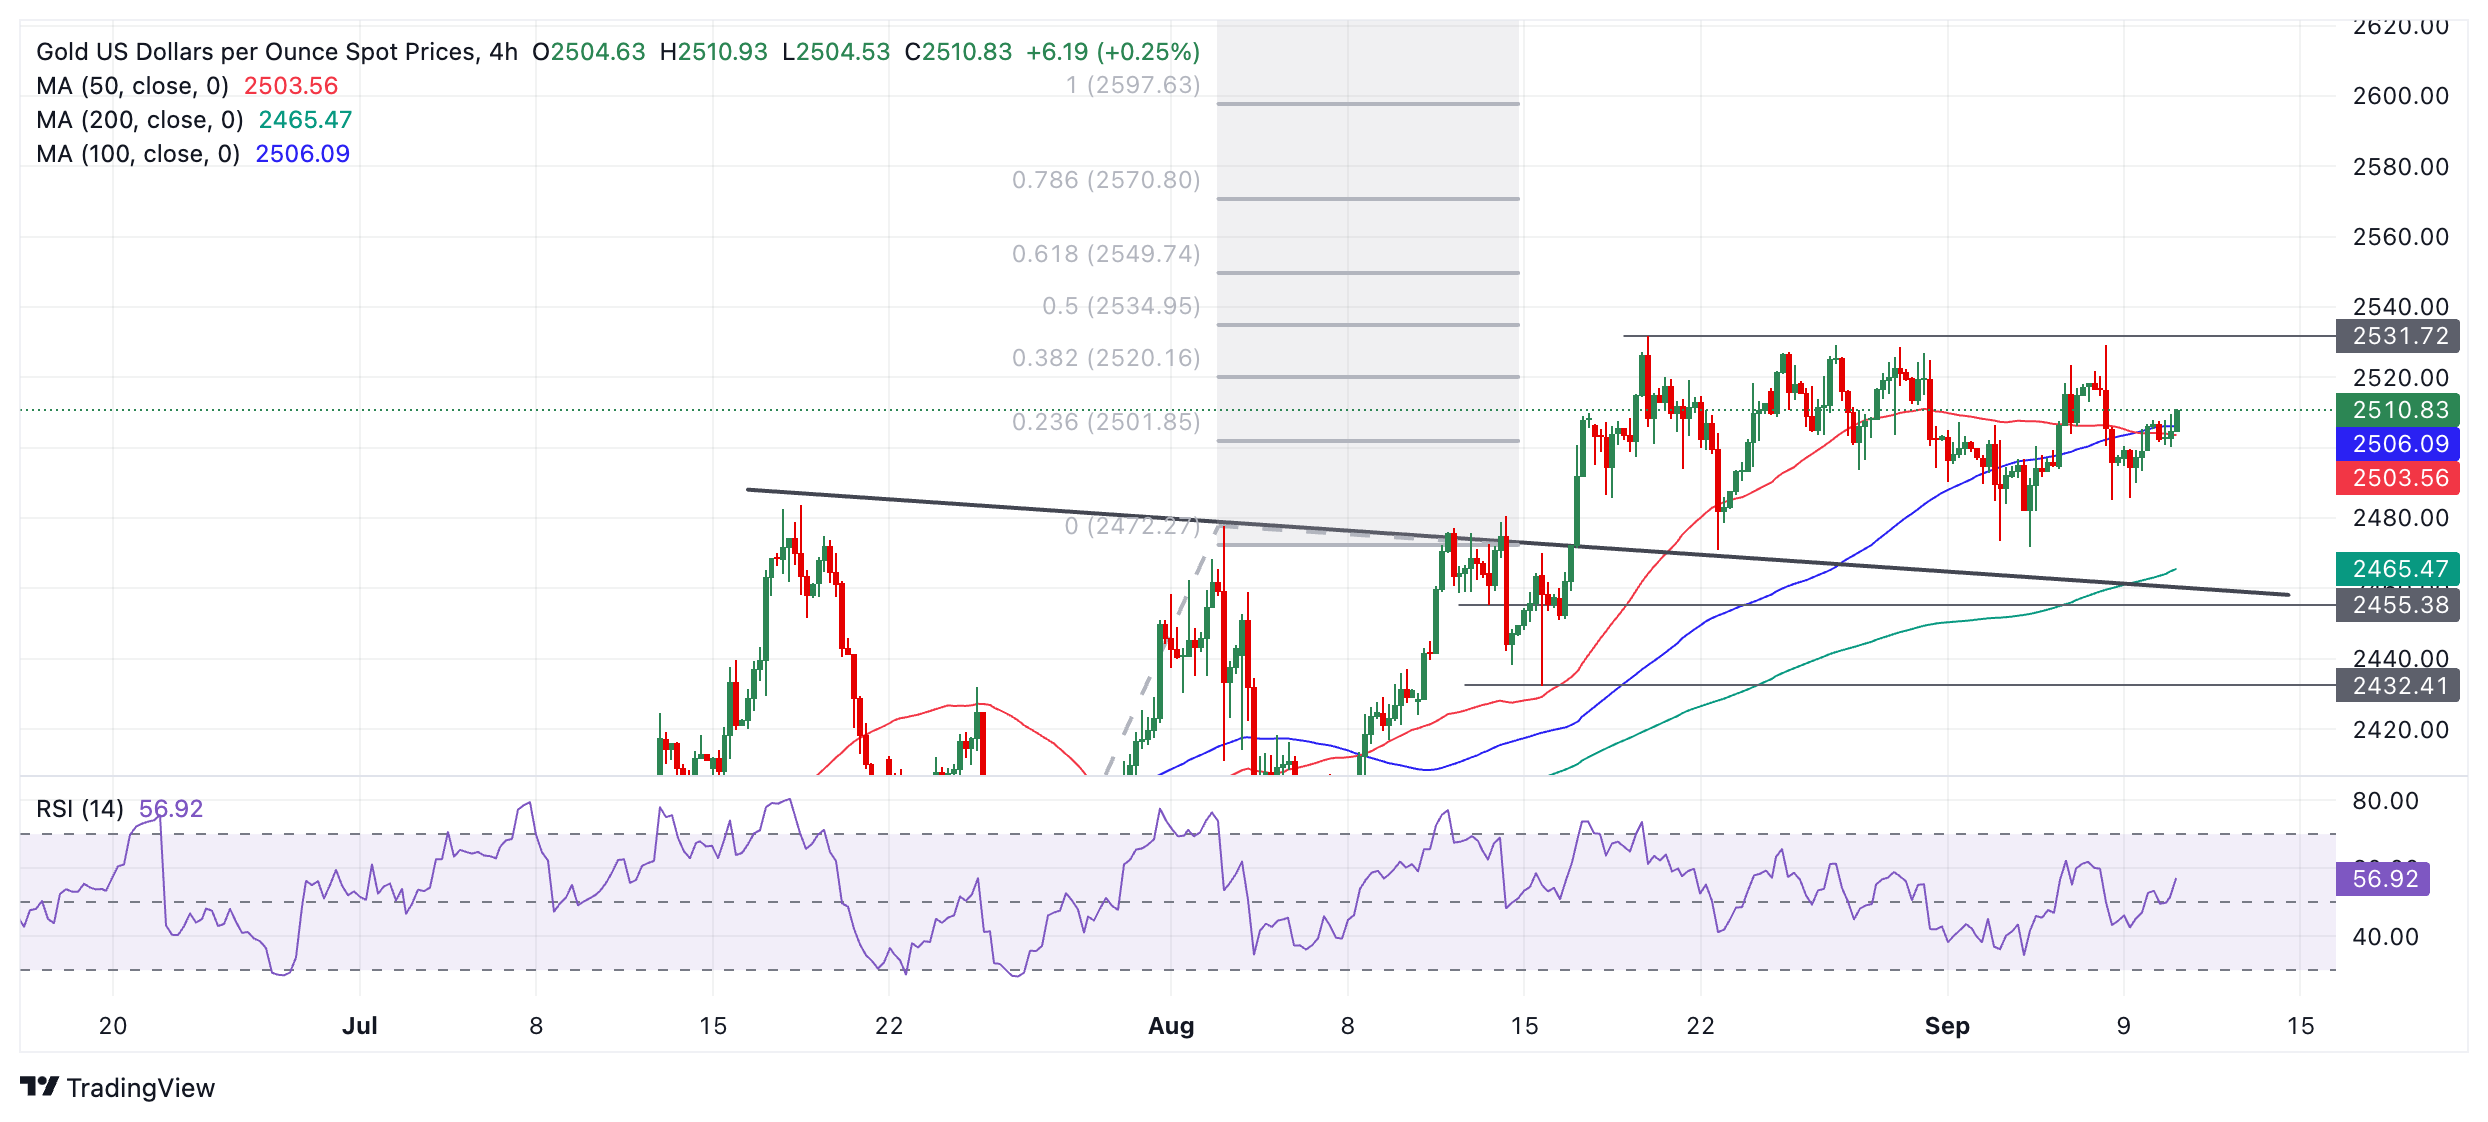
The yellow metal will probably continue trading up and down within this range until it breaks decisively out of one side or another.
A decisive break would be one accompanied by a long green or red candle that broke clearly through the top or bottom of the range and then closed near its highs or lows, or three candles in a row of the same color that pierced through the level.
Gold’s longer-term trend is bullish, however, slightly enhancing the odds of an upside breakout. Gold has an as-yet unreached bullish target at $2,550, generated after the original breakout from the July-August range on August 14. It will probably finally reach its goal in the end, assuming the uptrend survives.
A break above the August 20 all-time high of $2,531 would provide more confirmation of a continuation higher toward the $2,550 target.
If Gold continues steadily weakening, however, a decisive break below the range floor and a close below $2,460 would change the picture and suggest that the commodity might be starting a more pronounced downtrend.
Economic Indicator
Consumer Price Index (YoY)
Inflationary or deflationary tendencies are measured by periodically summing the prices of a basket of representative goods and services and presenting the data as The Consumer Price Index (CPI). CPI data is compiled on a monthly basis and released by the US Department of Labor Statistics. The YoY reading compares the prices of goods in the reference month to the same month a year earlier.The CPI is a key indicator to measure inflation and changes in purchasing trends. Generally speaking, a high reading is seen as bullish for the US Dollar (USD), while a low reading is seen as bearish.
Read more.Next release: Wed Sep 11, 2024 12:30
Frequency: Monthly
Consensus: 2.6%
Previous: 2.9%
Source: US Bureau of Labor Statistics
The US Federal Reserve has a dual mandate of maintaining price stability and maximum employment. According to such mandate, inflation should be at around 2% YoY and has become the weakest pillar of the central bank’s directive ever since the world suffered a pandemic, which extends to these days. Price pressures keep rising amid supply-chain issues and bottlenecks, with the Consumer Price Index (CPI) hanging at multi-decade highs. The Fed has already taken measures to tame inflation and is expected to maintain an aggressive stance in the foreseeable future.
Author

Joaquin Monfort
FXStreet
Joaquin Monfort is a financial writer and analyst with over 10 years experience writing about financial markets and alt data. He holds a degree in Anthropology from London University and a Diploma in Technical analysis.


