Gold recovers after release of disinflationary US “factory gate” price data
- Gold recovers on Thursday after the release of lower-than-expected US factory-gate price inflation data.
- The precious metal had retreated after the Federal Reserve’s more-sober-than-expected policy assessment.
- Gold spiked on Wednesday following cooler US inflation data, however, it later pulled back.
- XAU/USD might have formed a bearish Head-and-Shoulders pattern on the daily chart.

Gold (XAU/USD) trades higher and is currently exchanging hands in the $2,320s on Thursday, following some volatile moves. The yellow metal remains broadly stuck in the range between $2,270 and $2,450, the parameters of which were pegged out in April and early May.
Gold has recovered following the release of US Producer Price Index (PPI) data for May. The data showed a 0.2% decline in producer prices month-over-month, according to the US Bureau of Labor Statistics. This came after a 0.5% (revised) rise recorded in April, and was below the 0.2% consensus estimate.
PPI ex Food and Energy, meanwhile, flatlined in May MoM compared to a 0.5% rise in April, and underhot economists expectations of 0.3%.
The year-over-year readings were similarly lower. Headline PPI rose 2.2% YoY in May against 2.3% (revised up) in Apirl and below expectations of 2.5%. PPI ex Food & Energy rose 2.3% compared to 2.4% in the previous month and 2.4% expected.
The PPI data, informally known as "factor gate price" inflation, suggests the Federal Reserve (Fed) could move to cut interest rates sooner than previously thought. This is likely to support Gold by reducing the opportunity cost of holding the precious metal, making it more attractive to investors.
Gold was also benefited by US jobs data, which showed Initial Jobless Claims for the weak ending June 7, rising to 242K from 229K in the prior week, when 225K had been forecast, according to the US Department of Labor. These further recalibrated near-term interest-rate expectations lower, benefiting Gold.
Gold volatile on snap revisions to interest-rate outlook
Gold shot higher in the minutes following the release of US Consumer Price Index (CPI) data for May on Wednesday.
Headline CPI showed prices steadied month-over-month in May from the 0.3% increase in April, and edged up by 3.3% year-over-year compared to 3.4% previously. The readings were below economists's expectations of 0.1% MoM and 3.4% YoY.
CPI ex Food & Energy showed prices rose 0.2% MoM from 0.3% in April and 3.4% YoY from 3.6% previously. This was also below expectations of 0.3% and 3.5%, respectively.
The cooler-than-expected CPI data led to a sell-off in the US Dollar (USD) which is negatively correlated to Gold.
Gold price itself rose over half a percent to a peak of $2,342 after the release. The data provided a counterweight to US Nonfarm Payrolls (NFP) data on Friday, which reflected a buoyant labor market and rising wages in the US. These were expected to put upside pressure on inflation.
Fed pours cold water on rate cut hopes
Market optimism at the possibility of lower interest rates, however, was quickly curtailed by a more sober assessment from those that are responsible for setting interest rates, the officials of the US Federal Reserve.
The Fed did not see fit to alter interest rates at their June meeting on Wednesday, as expected. However, they did radically dial down projections of future rate cuts in their attached Summary of Economic Projections (SEP), or dot-plot. This showed Fed officials now on average project only one 0.25% reduction in 2024, compared to three 0.25% cuts in the previous March SEP.
“The revised Summary of Economic Projections, the so called dot-plot published alongside the policy statement, showed that 4 of 19 officials saw no rate cuts in 2024, 7 projected a 25 basis points (bps) rate reduction, while 8 marked down a 50 bps cut in the policy rate,” says Eren Sengezer, Lead Analyst at FXStreet.
Gold retreated on the news, pulling back down to close the day at $2,325.
Technical Analysis: Gold potentially forming Head-and-Shoulders
Gold is potentially forming a bearish Head-and-Shoulders (H&S) price pattern. These patterns generally occur at market tops and signal a change of trend. If the H&S is valid it may be an indication that the medium-term bull trend is reversing.
XAU/USD Daily Chart
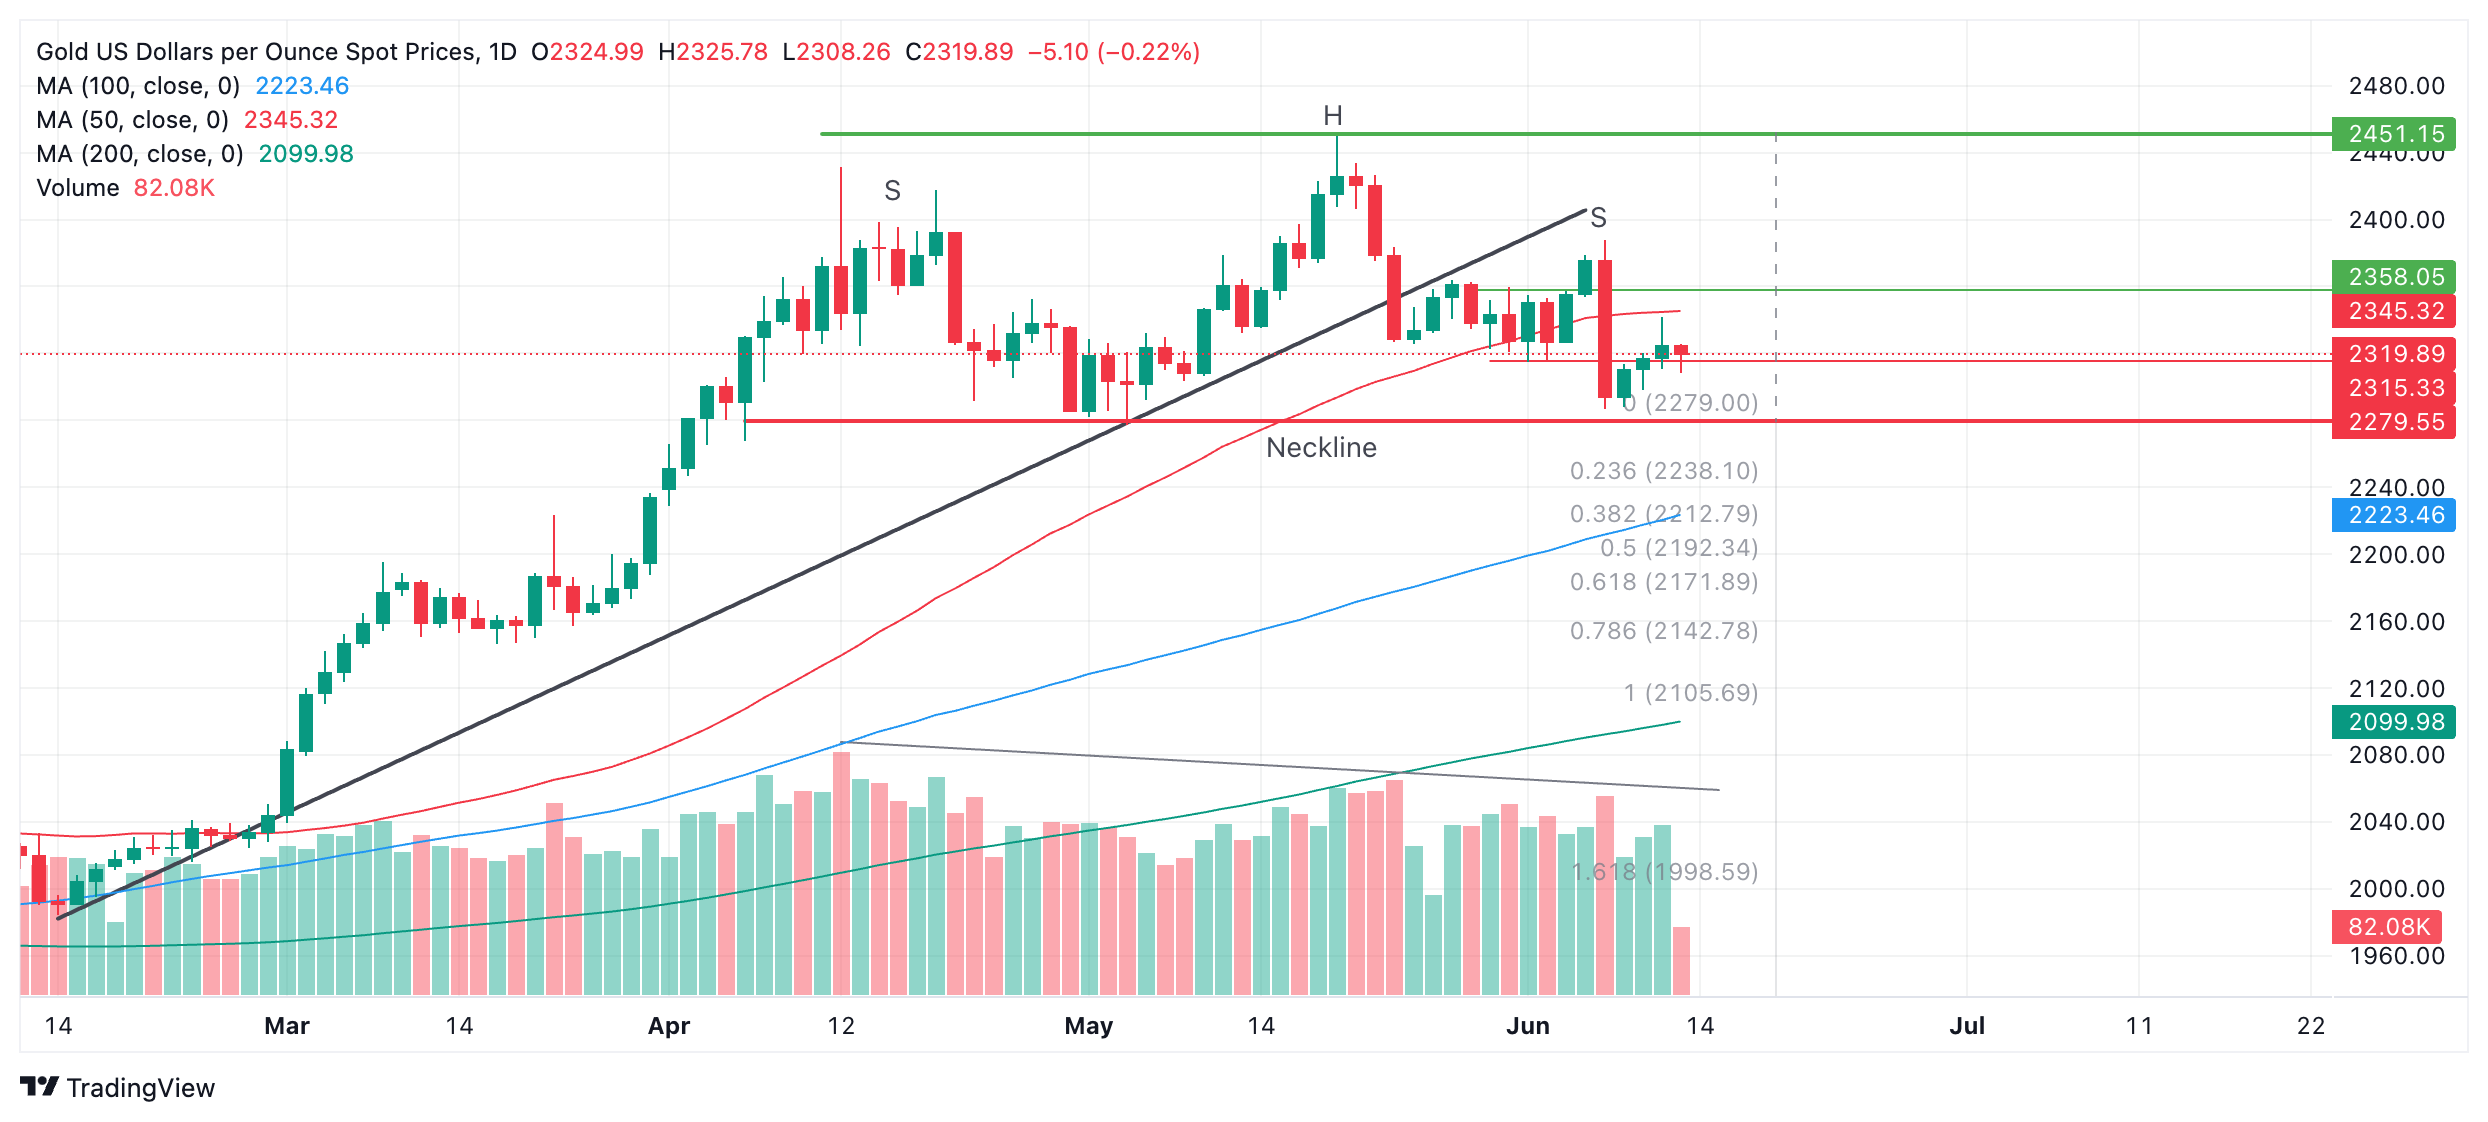
The H&S pattern began forming in April and has now completed a left and right shoulder (labeled “S”) and a “head” (labeled “H”). The so-called “neckline” of the pattern appears to be at the $2,279 support level (red line).
Declining trade volume during its development corroborates the pattern.
A decisive break below the neckline would validate the H&S pattern and activate downside targets. The first, more conservative, target would be $2,171, calculated by taking the 0.618 Fibonacci ratio of the height of the pattern and extrapolating it lower from the neckline. The second target would be at $2,106, the full height of the pattern extrapolated lower.
A break above $2,345, however, would bring the H&S into doubt and could signal a continuation higher, to an initial target at the $2,450 peak.
Economic Indicator
Producer Price Index (YoY)
The Producer Price Index released by the Bureau of Labor statistics, Department of Labor measures the average changes in prices in primary markets of the US by producers of commodities in all states of processing. Changes in the PPI are widely followed as an indicator of commodity inflation. Generally speaking, a high reading is seen as positive (or bullish) for the USD, whereas a low reading is seen as negative (or bearish).
Read more.Last release: Thu Jun 13, 2024 12:30
Frequency: Monthly
Actual: 2.2%
Consensus: 2.5%
Previous: 2.2%
Source: US Bureau of Labor Statistics
Author

Joaquin Monfort
FXStreet
Joaquin Monfort is a financial writer and analyst with over 10 years experience writing about financial markets and alt data. He holds a degree in Anthropology from London University and a Diploma in Technical analysis.


