Gold sees selling pressure build towards the US trading session with weekly gains at risk
- Gold price sees fade getting broader on Friday after its stellar three-day rally.
- Fed governor Waller's dovish comments raises concerns amongst traders on what markets are missing.
- Gold tries to consolidate a weekly gain and tries to hold above $2,700.

Gold’s price (XAU/USD) sees selling pressure pick up with the $2,700 level nearing on Friday, with profit-taking occurring after its three-day rally this week. Federal Reserve (Fed) governor Christopher Waller spooked traders by commenting on Thursday that a March interest rate cut should not be ruled out. That triggered uncertainty among traders because markets were not pricing in a March rate cut at all.
Concerns are now swelling, with traders questioning whether they might have missed an important element or whether a knee-jerk reaction could occur once President-elect Donald Trump takes office on Monday. A large number of executive orders are set to be released by Trump’s administration, including quite a few that guarantee a surge in inflation.
Daily digest market movers: Risks at hand
- Gold set a series of record highs last year as the Fed pivoted toward interest rate cuts, the world’s major central banks bought up the precious metal, and heightened tensions drove haven demand. The metal will rise to new peaks later this year on trade and geopolitical uncertainties, UBS Group AG said this week, Bloomberg reports.
- At 20:30 GMT, the Commodity Futures Trading Commission (CFTC) will release its weekly Commitment of Traders (COT) report. The report provides information on the size and direction of the positions taken across all maturities by participants primarily based in Chicago and New York futures markets in "non-commercial" or speculative positions. No forecast is available, but the release last Friday showed a jump to $254.9K, up from $247.3K the previous week.
- The US 10-year yield trades around 4.568%, over 5.0% lower than its weekly peak of 4.807% seen on Tuesday.
Technical Analysis: Waller took away the tailwind
Gold bulls are confused after comments from Fed Governor Waller that an interest rate cut in March should not be ignored. Traders were enjoying a supportive tailwind in Bullion fueled by easing rate-cut bets. With the Fed’s Waller call now for a possible move in March, concern grows that the Fed is seeing issues ahead in the US economy, which traders might have missed.
All eyes will be on the $2,708 pivotal level to see if it can keep the rally at elevated levels before heading into the weekend. If traders are unable to keep the Gold price above that level by the closing bell on Friday, rather look for $2,671 as the next support. In case more downside occurs, the 55-day Simple Moving Average (SMA) at $2,648 is next, followed by the 100-day SMA at $2,643.
The first upside level to look at is $2,721, which is a sort of a double top in November and December. In case Bullion powers through that level, the all-time high of $2,790 is the key upside barrier.
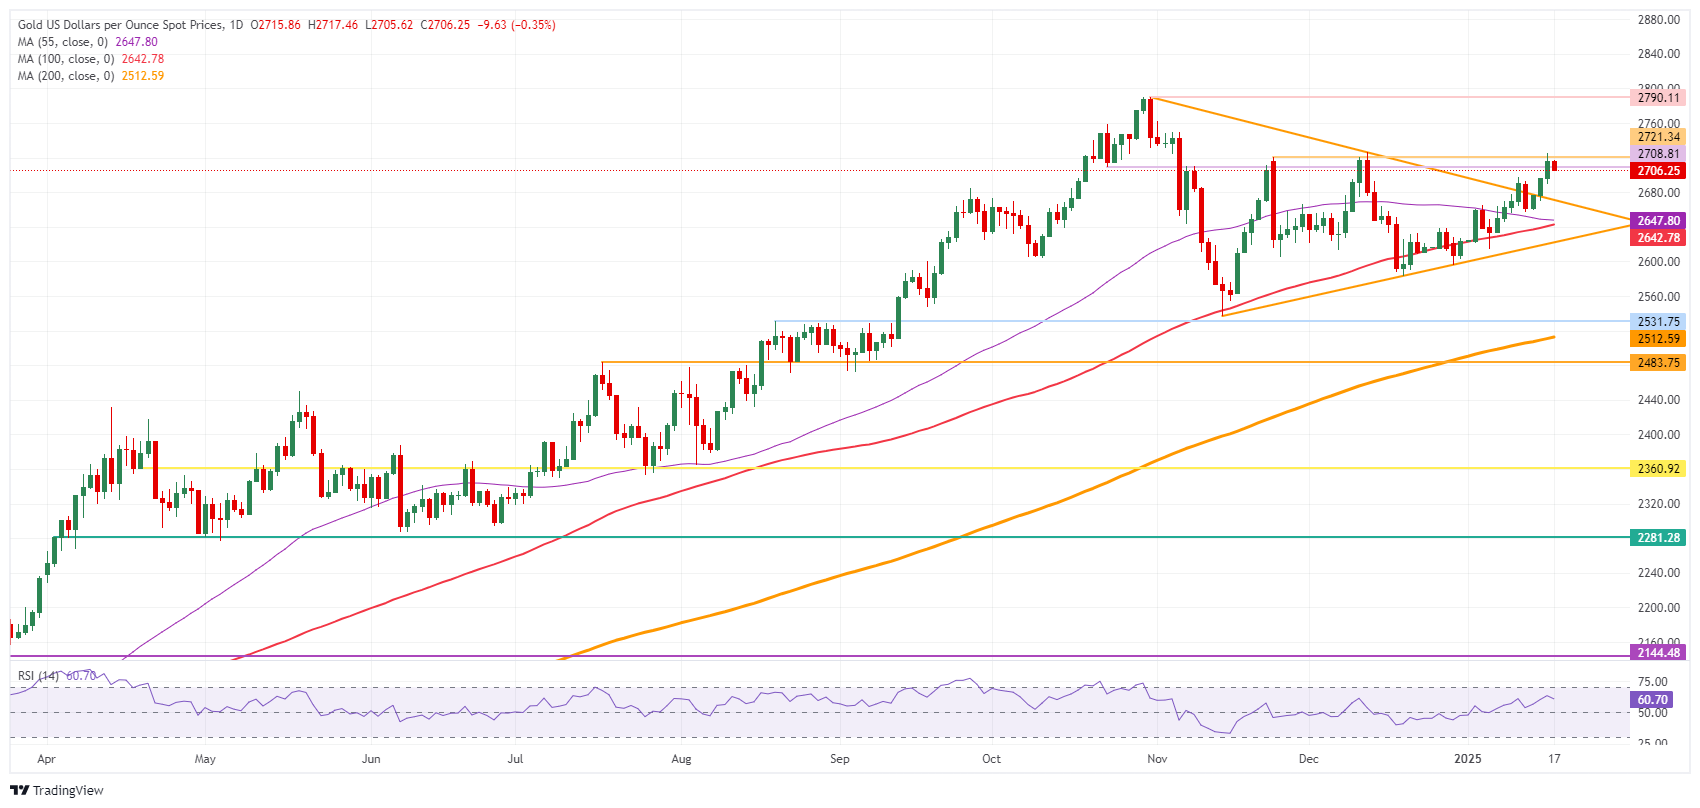
XAU/USD: Daily Chart
Gold FAQs
Gold has played a key role in human’s history as it has been widely used as a store of value and medium of exchange. Currently, apart from its shine and usage for jewelry, the precious metal is widely seen as a safe-haven asset, meaning that it is considered a good investment during turbulent times. Gold is also widely seen as a hedge against inflation and against depreciating currencies as it doesn’t rely on any specific issuer or government.
Central banks are the biggest Gold holders. In their aim to support their currencies in turbulent times, central banks tend to diversify their reserves and buy Gold to improve the perceived strength of the economy and the currency. High Gold reserves can be a source of trust for a country’s solvency. Central banks added 1,136 tonnes of Gold worth around $70 billion to their reserves in 2022, according to data from the World Gold Council. This is the highest yearly purchase since records began. Central banks from emerging economies such as China, India and Turkey are quickly increasing their Gold reserves.
Gold has an inverse correlation with the US Dollar and US Treasuries, which are both major reserve and safe-haven assets. When the Dollar depreciates, Gold tends to rise, enabling investors and central banks to diversify their assets in turbulent times. Gold is also inversely correlated with risk assets. A rally in the stock market tends to weaken Gold price, while sell-offs in riskier markets tend to favor the precious metal.
The price can move due to a wide range of factors. Geopolitical instability or fears of a deep recession can quickly make Gold price escalate due to its safe-haven status. As a yield-less asset, Gold tends to rise with lower interest rates, while higher cost of money usually weighs down on the yellow metal. Still, most moves depend on how the US Dollar (USD) behaves as the asset is priced in dollars (XAU/USD). A strong Dollar tends to keep the price of Gold controlled, whereas a weaker Dollar is likely to push Gold prices up.
Author

Filip Lagaart
FXStreet
Filip Lagaart is a former sales/trader with over 15 years of financial markets expertise under its belt.