Gold lifted by lower global interest-rate expectations
- Gold strengthens on the back of a decline in global interest-rate expectations.
- Overall weaker growth and cooler inflation in many countries is indicating central banks are about to start cutting interest rates.
- This is positive for non-yielding Gold, which tends to appreciate when interest rates fall.

Gold (XAU/USD) is trading in a mini-range in the $2,340s and is showing a daily gain of almost a percent on Wednesday. A string of poor economic data releases from the US have increased bets the Federal Reserve (Fed) will cut interest rates before the end of the year, and at a global level inflation is falling and several central banks are preparing to cut interest rates This lowers the opportunity cost of holding non-yielding Gold, making it overall more attractive to investors.
At the same time, a surprise increase in the US ISM Services PMI data, released Wednesday, suggests activity in the sector remains solid, and provides an antidote to the run of negative data the US has experienced of late. The ISM Services PMI rose to 53.8 in May, from 49.4 previously when an increase to only 50.8 had been forecast by economists.
The gains were mainly driven by a rise in New Orders which rose to 54.1 from 52.2 in April, whilst the Prices Paid component moderated down to 58.1 from 59.2 respectively, suggesting a slight easing in high Services inflation.
Gold edges higher as rate cuts loom
Gold drifts higher on Wednesday as more incoming macroeconomic data indicates the global economy is cooling and interest rates might be set to fall.
Eurozone factory-gate prices fell by 1.0% in April month-over-month, Producer Price Index (PPI) data from Eurostat showed on Wednesday. The result was lower than the 0.5% decline expected by economists and the revised 0.5% fall in the previous month. Although lower energy prices were responsible for the decline, other core costs also cooled, such as non-durables, which slowed to 0.1% from 0.6% previously.
Inflation data has been generally undershooting globally. Friday’s US core PCE data missed expectations and Swiss inflation similarly missed the mark on Tuesday, after coming out at 0.3% month-over-month in May when economists had estimated a 0.4% rise.
In Australia, first quarter GDP growth data out on Wednesday undershot estimates of 0.2% MoM and 1.2% YoY, coming out at 0.1% and 1.1% respectively instead.
US JOLTS Job openings data out Tuesday showed a sharp fall below estimates, coming out at 8.059 million when 8.340 million had been expected, and was well below the 8.355 million in March. The data suggested the US labor market is “further normalizing,” according to Thomas Ryan, North America Economist at Capital Economics.
ADP Employment Change data in May, meanwhile, which measures labor market trends in the private sector, came out at 152K missing estimates of 173K from a revised down 188K.
Several central banks are tipped to lower interest rates in June, including the European Central Bank (ECB) – which holds its meeting on Thursday –, the Bank of Canada (BoC) – which holds its meeting today (Wednesday) – and the Swiss National Bank (SNB), which will meet later in June. The trend supports Gold.
Gold short-term bearish but fundamentals solid – TD Securities
Despite a firm fundamental backdrop supporting Gold, Ryan McKay, Senior Commodity Strategist at TD Securities is bearish in the short-term.
“Trend signals in Gold are no longer unilaterally pointing to the upside, and in fact, CTAs have become modest sellers in the yellow metal amid the recent correction in prices. However, this deterioration in short-term trend signals is expected to remain contained with a large margin of safety still remaining before the next selling trigger at the $2,209/oz mark,” says McKay.
The negative short-term bias is balanced, however, by solid Asian demand for the purposes of currency hedging, especially against the US Dollar.
“We see Gold on a solid footing as our tracking of trading activity in Chinese Gold ETFs suggest inflows have resumed at the fastest pace since the epic buying activity that hit the tapes in April,” says McKay. “Precious metals have increasingly morphed into a currency depreciation hedge, with resumed pressures in Asia pointing to nascent signs of notable buying activity,” he adds.
Technical Analysis: Gold trades along 50-day SMA
Gold price is trading in a mini-range over the last four to five days around the 50-day Simple Moving Average (SMA) which is acting as a kind of tether.
XAU/USD’s break below a major trendline, however, might have ushered in a short-term downtrend, which given “the trend is your friend” could extend.
XAU/USD Daily Chart
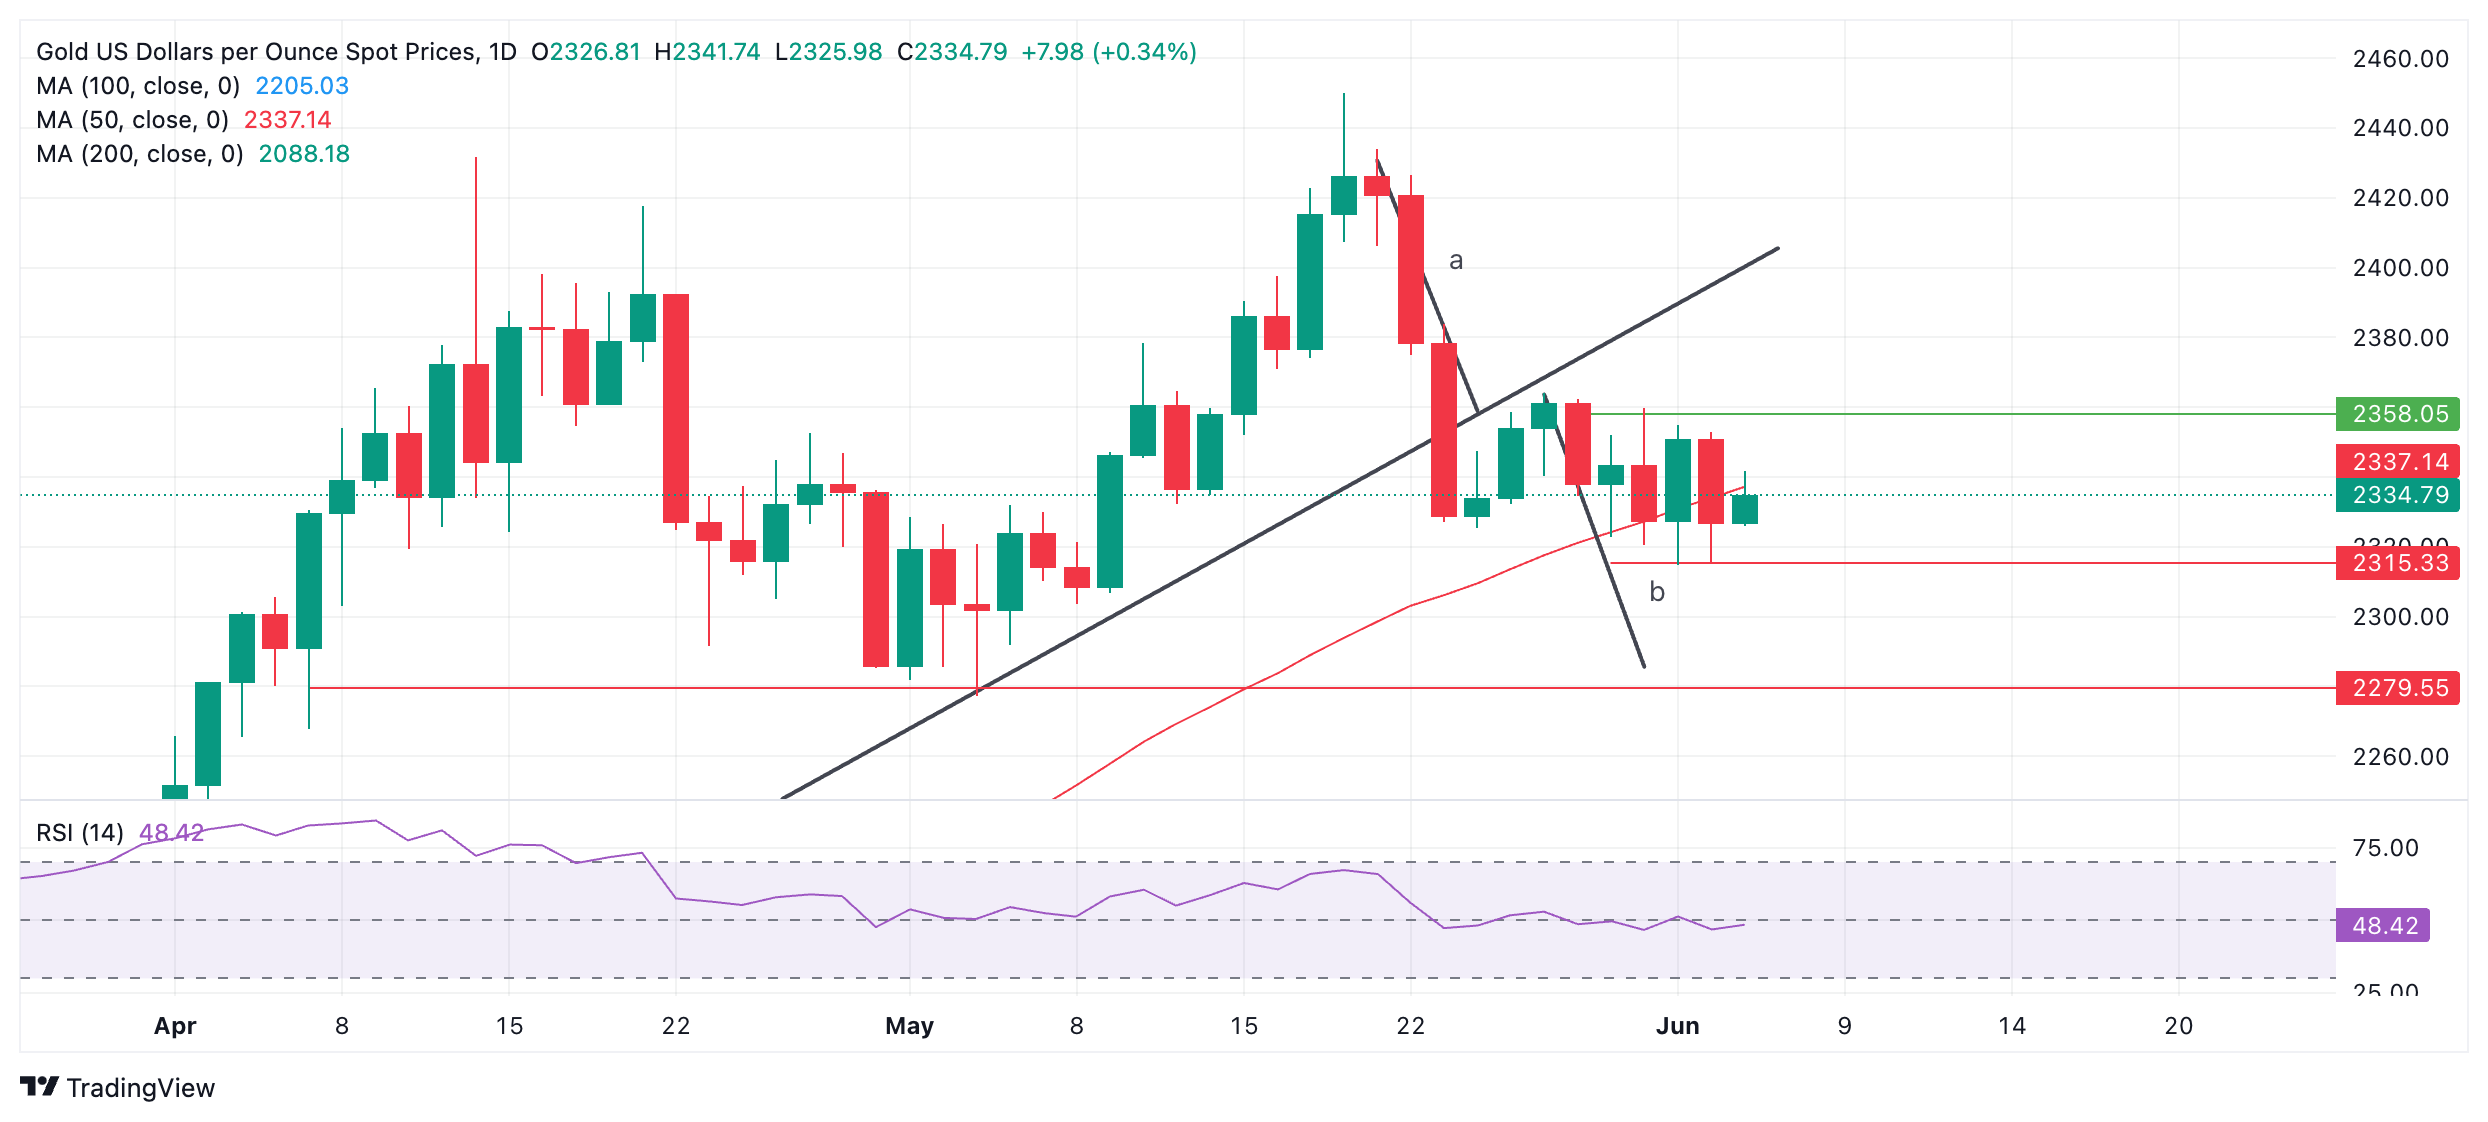
The break below the trendline generated downside targets. The length of the move prior to a break can be used as a guide to the follow-through move after a break, according to technical analysis. In the case of Gold, the prior move is labeled “a” and the follow-through “b”.
The first target for the follow-through is at $2,303, which is the 0.618 Fibonacci extrapolation of “a”.
Gold could even fall to $2,272-$2,279, the 100% extrapolation of “a” and the end of “b”. This also happens to be an area of historical support (red line).
The precious metal’s medium and long-term trends, however, are still bullish and the risk of a recovery remains high. That said, price action is not supporting a resumption hypothesis at the moment.
A break above $2,362 (May 29 high) would be required to bring into doubt the integrity of the short-term downtrend, otherwise further weakness is foreseen.
Economic Indicator
ISM Services PMI
The Institute for Supply Management (ISM) Services Purchasing Managers Index (PMI), released on a monthly basis, is a leading indicator gauging business activity in the US services sector, which makes up most of the economy. The indicator is obtained from a survey of supply executives across the US based on information they have collected within their respective organizations. Survey responses reflect the change, if any, in the current month compared to the previous month. A reading above 50 indicates that the services economy is generally expanding, a bullish sign for the US Dollar (USD). A reading below 50 signals that services sector activity is generally declining, which is seen as bearish for USD.
Read more.Last release: Wed Jun 05, 2024 14:00
Frequency: Monthly
Actual: 53.8
Consensus: 50.8
Previous: 49.4
Source: Institute for Supply Management
The Institute for Supply Management’s (ISM) Services Purchasing Managers Index (PMI) reveals the current conditions in the US service sector, which has historically been a large GDP contributor. A print above 50 shows expansion in the service sector’s economic activity. Stronger-than-expected readings usually help the USD gather strength against its rivals. In addition to the headline PMI, the Employment Index and the Prices Paid Index numbers are also watched closely by investors as they provide useful insights regarding the state of the labour market and inflation.
Author

Joaquin Monfort
FXStreet
Joaquin Monfort is a financial writer and analyst with over 10 years experience writing about financial markets and alt data. He holds a degree in Anthropology from London University and a Diploma in Technical analysis.


