Gold steadies as traders brace for US CPI data, FOMC’s monetary policy decision
- Gold trades up 0.07% as markets brace for significant US economic releases.
- US NFIB Small Business Optimism Index exceeds expectations, signaling robust economic sentiment.
- Upcoming CPI and FOMC decision, including the ‘dot plot,’ expected to impact Gold prices amid persistent inflation concerns.

Gold prices advanced for the second straight day amid a stronger US Dollar, yet it remains near familiar levels as traders brace for the release of crucial data from the United States (US). XAU/USD traders are in wait-and-see mode as the Federal Open Market Committee (FOMC) begins its two-day meeting, which will unveil the latest monetary policy decision on Wednesday. The XAU/USD trades at $2,311, up 0.07% and virtually unchanged.
Tuesday’s US economic docket remains scarce with just the release of the May NFIB Small Business Optimism Index, which exceeded estimates and April’s data. On Wednesday, the Consumer Price Index (CPI) is expected to remain firm near April’s numbers, hinting that inflation remains stubbornly high even though the Federal Reserve (Fed) raised rates by more than 500 basis points during the last few years.
After the CPI, the Fed, led by its Chair Jerome Powell, will release its monetary policy statement and the Summary of Economic Projections (SEP), which includes the famous ‘dot plot’ that depicts a “probable path’ for monetary policy.
A Reuters poll hinted that most analysts estimate a 25-basis-point (bps) interest rate cut by the Fed, in 2024. Meanwhile, data from the Chicago Board of Trade (CBOT) shows that the December 2024 fed funds futures contract suggests that most traders expect 28 bps of easing toward the end of the year.
In the meantime, the US 10-year Treasury note yield edges down six basis points to 4.41%, a headwind for the yellow metal. Consequently, the DXY, an index of the US Dollar against six other currencies, increased 0.15% to 105.25.
Daily digest market movers: Gold price stays firm ahead of US inflation, Fed’s decision
- News that the People’s Bank of China paused its 18-month bullion buying spree weighed on the precious metal. “Holdings of the precious metal by the PBOC held steady at 72.80 million troy ounces for May,” according to MarketWatch.
- The US NFIB Small Business Optimism Index in May reached its highest level of the year at 90.5, up from April’s 89.7.
- NFIB Chief Economist Bill Dunkelberg commented that inflation is the “single most important problem” in business operations. Companies expected to hire more people according to the survey, adding that financing is one of the top business problems.
- US CPI for May is expected to dip from 0.3% to 0.1% MoM, and core CPI is projected to remain steady at 0.3% MoM.
- In the 12 months to May, CPI is expected to remain unchanged at 3.4% compared to April, with the underlying core CPI expected to decelerate from 3.6% to 3.5%.
- Last week’s US jobs data hinted that the US economy remains robust, making the Fed less adept at easing policy. However, a softer-than-expected inflation report could influence Fed Chair Powell and company to keep their stance of expecting three interest rate cuts toward the end of the year.
- According to the CME FedWatch Tool, Tuesday’s odds for a Fed rate cut in September dipped from 50% last week to 46.7%.
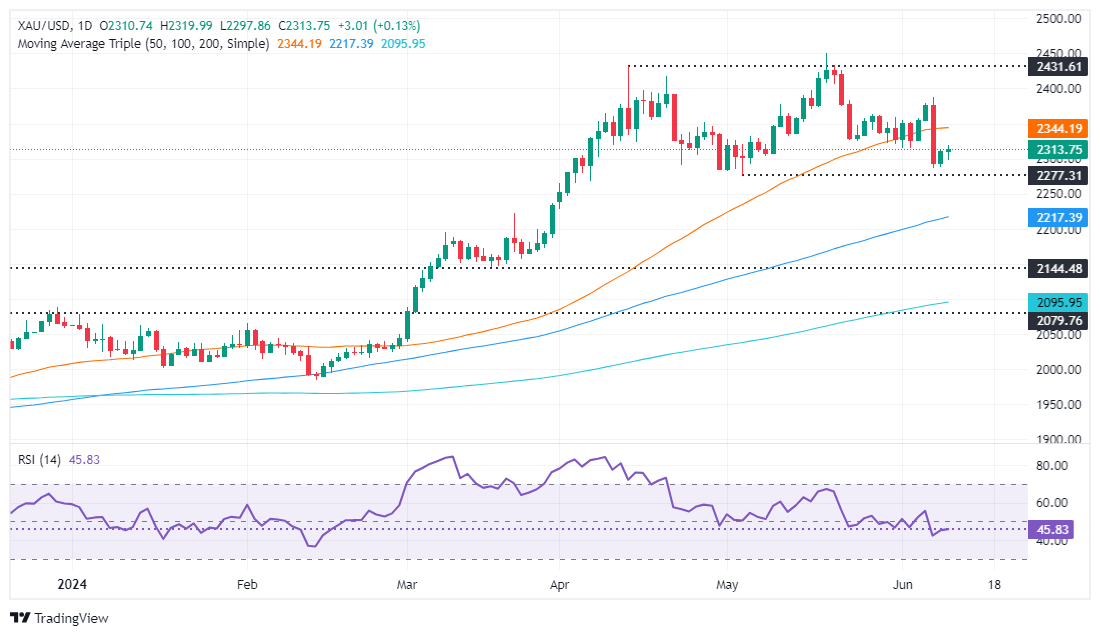
Technical analysis: Gold price climbs, hovers around $2,310
Gold price formed a Head-and-Shoulders chart pattern, which suggests the yellow metal could be headed to hit the pattern objective from $2,160 to $2,170. However, the non-yielding metal is still subdued at $2,300, awaiting a fresh catalyst, which could be the Fed’s monetary policy decision.
If XAU/USD drops below the $2,300 figure, the next demand area would be the May 3 low of $2,277, followed by the March 21 high of $2,222. Further losses lie beneath with buyers’ next line of defense close to the $2,200 figure.
Conversely, if Gold buyers lift prices above $2,350, look for a consolidation in the $2,350 to $2,380 area.
Gold FAQs
Gold has played a key role in human’s history as it has been widely used as a store of value and medium of exchange. Currently, apart from its shine and usage for jewelry, the precious metal is widely seen as a safe-haven asset, meaning that it is considered a good investment during turbulent times. Gold is also widely seen as a hedge against inflation and against depreciating currencies as it doesn’t rely on any specific issuer or government.
Central banks are the biggest Gold holders. In their aim to support their currencies in turbulent times, central banks tend to diversify their reserves and buy Gold to improve the perceived strength of the economy and the currency. High Gold reserves can be a source of trust for a country’s solvency. Central banks added 1,136 tonnes of Gold worth around $70 billion to their reserves in 2022, according to data from the World Gold Council. This is the highest yearly purchase since records began. Central banks from emerging economies such as China, India and Turkey are quickly increasing their Gold reserves.
Gold has an inverse correlation with the US Dollar and US Treasuries, which are both major reserve and safe-haven assets. When the Dollar depreciates, Gold tends to rise, enabling investors and central banks to diversify their assets in turbulent times. Gold is also inversely correlated with risk assets. A rally in the stock market tends to weaken Gold price, while sell-offs in riskier markets tend to favor the precious metal.
The price can move due to a wide range of factors. Geopolitical instability or fears of a deep recession can quickly make Gold price escalate due to its safe-haven status. As a yield-less asset, Gold tends to rise with lower interest rates, while higher cost of money usually weighs down on the yellow metal. Still, most moves depend on how the US Dollar (USD) behaves as the asset is priced in dollars (XAU/USD). A strong Dollar tends to keep the price of Gold controlled, whereas a weaker Dollar is likely to push Gold prices up.
Author

Christian Borjon Valencia
FXStreet
Markets analyst, news editor, and trading instructor with over 14 years of experience across FX, commodities, US equity indices, and global macro markets.


