Gold price surrenders major part of intraday gains; downside potential seems limited
- Gold price struggles to capitalize on its modest intraday gains amid mixed fundamental cues.
- Expectations for a less dovish Fed and elevated US bond yields cap gains for the XAU/USD.
- Geopolitical risks, trade war fears and Fed rate cut bets could lend support to the precious metal.

Gold price (XAU/USD) surrenders a major part of its intraday gains and retreats to the lower end of the daily range during the first half of the European session on Friday. The growing market conviction that the Federal Reserve (Fed) will adopt a cautious stance on cutting interest rates, amid signs that the progress in lowering inflation to its 2% target has stalled, remains supportive of elevated US Treasury bond yields. This, in turn, assists the US Dollar (USD) to preserve its gains registered over the past week or so, to a fresh monthly peak and acts as a headwind for the non-yielding yellow metal.
Any meaningful downside for the Gold price, however, seems limited as traders might refrain from placing aggressive bets and opt to move to the sidelines ahead of the highly-anticipated two-day FOMC policy meeting starting next Tuesday. Apart from this, geopolitical risks stemming from the Russia-Ukraine war and tensions in the Middle East, along with concerns over US President-elect Donald Trump's tariff plans, might support the safe-haven bullion. This, in turn, warrants some caution before positioning for an extension of the previous day's sharp retracement slide from a five-week high.
Gold price lacks bullish conviction amid elevated US bond yields
- Ukraine has fired US-supplied missiles, targeting strategic sites deep into Russian territory. Meanwhile, Russian forces edge closer to a key eastern Ukraine city Pokrovsk after monthlong intense fighting.
- Israel said on Thursday that its military would stay in the Syrian territory it seized until a new force was established that met its security demands and filled the vacuum after the collapse of the Syrian regime.
- This marks a significant escalation in geopolitical tensions and drives some haven flows towards the Gold price amid bets that the Federal Reserve will lower borrowing costs at the end of the December meeting.
- In the absence of any major upside surprise from the latest US consumer inflation figures released on Wednesday, the markets now seem to have fully priced in a 25 basis points Fed rate cut move next week.
- The US Bureau of Labor Statistics reported on Thursday that the headline Producer Price Index (PPI) rose 0.4% in November and the yearly rate accelerated from 2.6% in October to 3% during the reported month.
- The annual core PPI rose 0.2% in November and stood at 3.4% compared to the same time period last year, beating estimates and indicating that the progress in lowering inflation to the 2% target has stalled.
- This comes on top of expectations that US President Donald Trump's expansionary policies will boost inflation and suggests that the Fed will adopt a more cautious stance on cutting interest rates going forward.
- Expectations for a less dovish Fed continue to push the US Treasury bond yields and assist the US Dollar to preserve its weekly gains to a fresh monthly peak, which might cap the lower-yielding yellow metal.
- Investors keenly await the crucial FOMC policy decision next week for cues about the interest rate outlook in the US. This will drive the USD demand and provide some meaningful impetus to the XAU/USD.
Gold price needs to break below $2,675 for bears to seize control
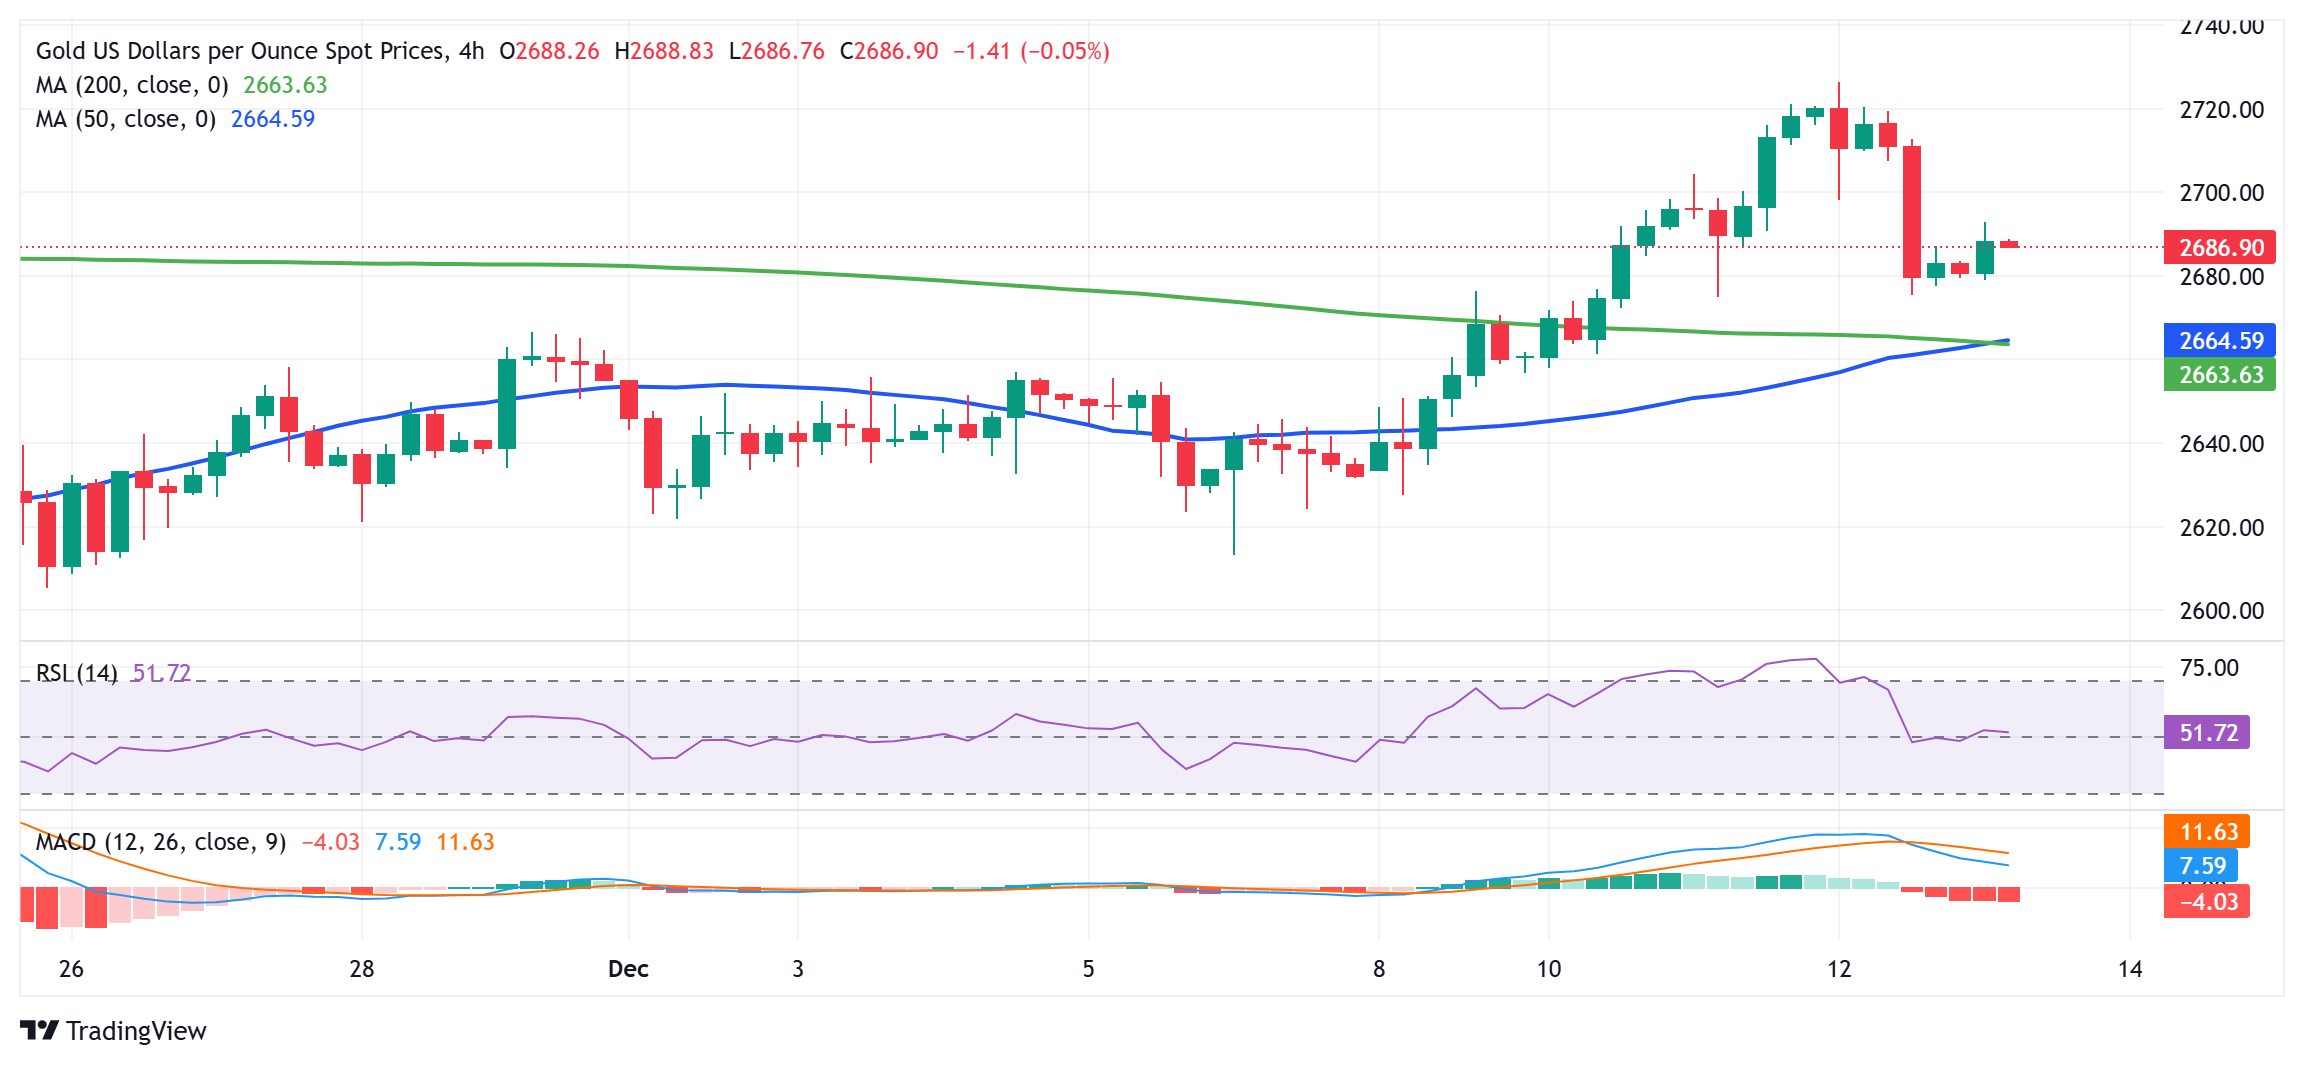
From a technical perspective, any further strength back above the $2,700 mark is likely to confront resistance near the $2,725-26 region or the monthly high touched on Thursday. The subsequent move up could lift the Gold price to the $2,735 intermediate hurdle en route to the $2,748-2,750 supply zone. The next relevant barrier is pegged near the $2,775 region, above which bulls might aim to challenge the all-time peak, around the $2,800 neighborhood touched in October.
On the flip side, the $2,675-2,674 area now seems to have emerged as an immediate strong support. A convincing break below, however, might prompt some technical selling and pave the way for further losses towards the $2,658-2,656 confluence – comprising 50- and 200-period Simple Moving Averages (SMAs) on the 4-hour chart. The latter should act as a key pivotal point, which if broken decisively could make the Gold price vulnerable to weaken further towards the $2,632-2,630 area en route to the $2,600 round-figure mark.
US Dollar PRICE This week
The table below shows the percentage change of US Dollar (USD) against listed major currencies this week. US Dollar was the strongest against the Japanese Yen.
| USD | EUR | GBP | JPY | CAD | AUD | NZD | CHF | |
|---|---|---|---|---|---|---|---|---|
| USD | 0.97% | 0.87% | 2.03% | 0.49% | 0.30% | 1.30% | 1.69% | |
| EUR | -0.97% | -0.09% | 1.18% | -0.40% | -0.58% | 0.40% | 0.79% | |
| GBP | -0.87% | 0.09% | 1.06% | -0.31% | -0.49% | 0.49% | 0.88% | |
| JPY | -2.03% | -1.18% | -1.06% | -1.54% | -1.61% | -0.84% | -0.25% | |
| CAD | -0.49% | 0.40% | 0.31% | 1.54% | -0.15% | 0.80% | 1.19% | |
| AUD | -0.30% | 0.58% | 0.49% | 1.61% | 0.15% | 0.99% | 1.38% | |
| NZD | -1.30% | -0.40% | -0.49% | 0.84% | -0.80% | -0.99% | 0.38% | |
| CHF | -1.69% | -0.79% | -0.88% | 0.25% | -1.19% | -1.38% | -0.38% |
The heat map shows percentage changes of major currencies against each other. The base currency is picked from the left column, while the quote currency is picked from the top row. For example, if you pick the US Dollar from the left column and move along the horizontal line to the Japanese Yen, the percentage change displayed in the box will represent USD (base)/JPY (quote).
Author

Haresh Menghani
FXStreet
Haresh Menghani is a detail-oriented professional with 10+ years of extensive experience in analysing the global financial markets.


